

Analysis of the challenges facing agro-pastoral households in Beletweyne, Somalia

Abstract
Agro-pastoral households in Somalia’s Hiiraan Region combine rain-fed and riverine cultivation with livestock keeping and face drought, flooding, input scarcity, weak services, thin markets and insecurity simultaneously. Studies of these constraints usually rank them by mean severity or by the percentage of households naming them, treating constraints as mutually exclusive and unable to say how many households would remain unaffected if a given set were removed. This article applies Total Unduplicated Reach and Frequency (TURF) analysis, a portfolio-optimisation technique from marketing science, to identify the smallest set of challenges that jointly reaches the largest share of agro-pastoral households. The design builds on a household survey of 96 households in three villages of Beletweyne District. TURF analysis is formalised in nine reproducible steps, from binarisation and coverage indicators to integer optimisation, bootstrap inference and sensitivity analysis, showing how outputs are read. The approach shifts challenge assessment from what is most common to what, in combination, covers most households, and offers a transparent evidence base for sequencing interventions in fragile settings.
Introduction
Agro-pastoralism is a livelihood system in which crop cultivation and livestock keeping are integrated within a household economy, so each enterprise cushions the other against the shocks to which it is exposed (Catley et al., 2013; Mukoya, 2019). In Somalia, the system is concentrated along the Shabelle and Juba rivers and in the adjoining rain-fed belt. Households plant sorghum, maize, cowpea and sesame in the Gu (April–June) and Deyr (October–December) rains, farm flood-recession and irrigated plots along the river, and keep cattle, goats, sheep and camels that are moved or sold as pasture, water and prices dictate. Beletweyne District in Hiiraan Region, which straddles the Shabelle in central Somalia, is a representative case: its riverine and rain-fed agro-pastoralists produce for subsistence and for the markets of the regional capital while remaining exposed to a climate in which drought and flood alternate.
The difficulties of these households are neither singular nor independent. Drought has returned repeatedly, the 2010–2012 famine being its most severe expression, and Maystadt and Ecker (2014) show that drought-induced livestock price shocks can feed directly into conflict in Somalia. Shabelle floods periodically submerge farmland and displace households, while decades of insecurity have degraded extension services, input markets and rural finance. Humanitarian and development agencies have nonetheless channelled considerable resources into seeds, fertiliser, tractor hours, irrigation and extension, and household food insecurity persists. Our own parent survey of 96 households in three Beletweyne villages illustrates why: 55.2% of respondents reported that extension services were available only to a little extent, 44.8% said market access existed to little or no extent, and key informants described a payment design in which beneficiaries received USD 150 weekly to cultivate but USD 90 for not cultivating, with many reportedly accepting the lower sum. Aid design, in other words, can itself become a constraint on production, a pattern consistent with wider evidence on the disincentive effects of food aid (Gelan, 2007; Gilligan & Hoddinott, 2007).
Despite this complexity, evidence on what constrains agro-pastoral households is typically generated by ranking. Adoption studies identify determinants of technology uptake (Mamudu et al., 2012; Ogada et al., 2014) and present constraints as a league table of mean Likert scores or percentages. Ranking has three weaknesses. First, the percentages cannot be added: if 60% of households cite drought and 55% cite weak credit, the two together do not reach 115% of households, because many are the same households. Second, a ranking says nothing about combinations, so it cannot tell a programme planner which two or three actions, taken together, would touch the greatest number of households. Third, programmes operate under budget and capacity limits, so the real decision is the selection of a small portfolio, not the ordering of a long list.
TURF analysis was developed in marketing to solve this problem precisely: of m candidate products, which k should be offered so that the largest number of distinct consumers find at least one appealing (Miaoulis et al., 1990)? Computationally, it is a maximal covering problem (Church & ReVelle, 1974). We invert the vocabulary. Households are the “consumers”, challenges are the “products”, and a household is “reached” by a set of challenges when it experiences at least one of them severely. Reach counts each household once, evenif it bears many challenges.Frequency records how many of the selected challenges the average reached household bears.
The conceptual anchor is the vulnerability context of the sustainable livelihoods framework (Scoones, 1998), in which shocks, trends and seasonality act on a household’s assets through institutions and policies. The framework names the stressors but offers no way of counting how many households they jointly affect; TURF supplies that counting rule, so that the vulnerability context becomes an empirical object and not only a checklist.
In this paper, the author argues that agro-pastoralists’ challenges should be assessed as a portfolio, not as a league table. The smallest set of challenges that reaches the greatest number of households is not, in general, the set of the most prevalent individual challenges, because prevalent challenges tend to be concentrated in the same households, whereas a less common challenge that falls on otherwise unaffected households adds more coverage.
Thispaperuses TURF analysis to determine the minimum combination of challenges that achieves the maximum unduplicated reach among agro-pastoral households in Beletweyne District, along with the frequency with which those challenges co-occur. The remainder of the article describes the study setting and design (Section 2), formalises the TURF model (Section 2.5), demonstrates and discusses its outputs (Section 3), and closes with conclusions, novelty and limitations (Sections 4–5).
Methods
Study area
The study area is Beletweyne District in the Hiiraan Region of central Somalia, bordering Ethiopia and traversed by the Shabelle River, which divides the regional capital, Beledweyne. The district is inhabited mainly by the Hawadle community and comprises two production zones: irrigated riverine land or land planted on flood recession, and rain-fed land beyond the river’s reach. Rainfall is bimodal, with the Gu and Deyr rains separated by the dry Hagaa and Jilaal seasons, so crop output and fodder vary widely from season to season. Irrigated crops include maize, sorghum, and beans, while rain-fed plots grow sesame and maize, and livestock are kept for milk, sale, and social obligations.
Figure 1
Map of Beletweyn district of Somalia
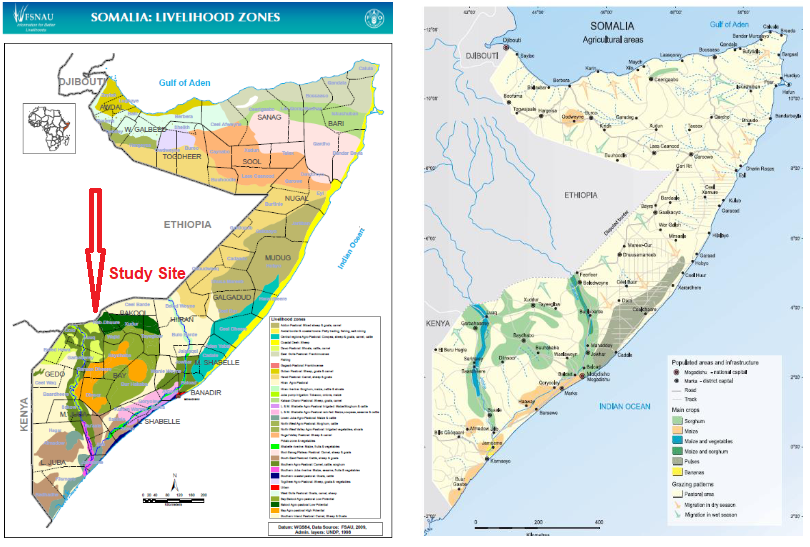
Three villages, Hodan, Buunda Weyn and Hawa-tako, were included. The district was purposively selected because it has received a large share of agricultural support in the form of seed, fertiliser, tractors, irrigation hours and extension, making the question of what still constrains households especially pressing. Security conditions in Hiiraan are fragile and shape fieldwork logistics.
Research design
The study is a non-experimental, cross-sectional descriptive survey in the tradition used in the parent study (Mugenda & Mugenda, 2003), embedded in a convergent mixed-methods design (Creswell & Plano Clark, 2018). The quantitative aspect, a structured household survey, supplies the household-by-challenge matrix on which TURF operates. The qualitative aspect, comprising key informant interviews, focus group discussions and field observation, serves two purposes: it generates and validates the challenge inventory before analysis, and it explains the quantitative patterns afterwards, for example, why particular challenges fall on the same households. Integration therefore occurs at the design stage (item generation) and at the interpretation stage (joint displays). The unit of analysis is the agro-pastoral household, defined, following the parent study, as one deriving over 50% of income from farming and 10–50% from livestock and livestock products. The unit of observation is the household head or principal decision-maker, a resident farmer engaged in both activities. All measures refer to the two most recent agricultural seasons (Gu and Deyr) to limit recall error.
Participants and sampling
The target population comprised rain-fed and riverine agro-pastoral households in the three villages. Simple random sampling gave each household a known and equal selection probability (Black, 2014). The sample size was computed with Cochran’s (1977) formula for a proportion at 95% confidence, maximum variability (p = 0.5) and a ±10% margin of error:
(1)
Ninety-six households were allocated across villages as 30 (Hodan), 33 (Buunda Weyn) and 33 (Hawa-tako). Of these, 64 (66.7%) respondents were male and 32 (33.3%) female; 45.8% had secondary education, 41.7% a diploma and 12.5% a bachelor’s degree; and 54.2% had practised agro-pastoralism for one to five years, 29.2% for more than five and 16.7% for under one year. Ten key informants (officers responsible for agriculture and pastoralism) were interviewed, and four focus-group discussions were held, two with male and two with female farmers. Because the sample is small and women are under-represented, village and sex weights (Step 5) and subgroup reporting are built into the analysis.
Data collection procedures
Data collection followed a university authorisation letter and permission from local authorities. Trained enumerators fluent in Somali administered the questionnaire face-to-face after obtaining oral informed consent, assuring respondents of anonymity and voluntary participation and explicitly stating that participation would not affect aid eligibility, which is important in a setting where respondents may expect benefits from being interviewed. The instrument combined closed- and open-ended items and a challenge module of twelve items (Table 1) in which each household rated, from 1 (not a problem) to 5 (very serious), how severe each challenge had been in the last two seasons. The researcher assembled the inventory from the adoption and food-security literature, expanded it through focus groups and key informant interviews, and had an academic supervisor and food-production specialists check it for content validity. A pilot with 10% of the sample, excluded from the final analysis, tested comprehension and timing; internal consistency of any multi-item scale was assessed with Cronbach’s (1951) alpha at a 0.70 threshold, and test–retest agreement on the binarised items was checked with Cohen’s kappa. Interviews and discussions were recorded with permission, transcribed and coded thematically (Braun & Clarke, 2006), and field observation notes recorded farming practices and aid-distribution events. Survey data were entered and cleaned in SPSS, and the TURF routines were run in R or Python.
| Code | Challenge | Domain | Operational indicator (last two seasons) |
|---|---|---|---|
| C1 | Drought and rainfall failure | Climatic | Crop or pasture and water shortfall from late or failed Gu/Deyr rains |
| C2 | Riverine flooding | Loss of crops, canals or assets to Shabelle overflow | |
| C3 | Crop pests and livestock disease | Losses to pests, rodents and animal disease outbreaks | |
| C4 | Seed and input access | Production | Unavailable or unaffordable improved seed, fertiliser and tools |
| C5 | Irrigation and mechanisation | Pump fuel costs, canal siltation, tractor-hour shortages | |
| C6 | Extension and veterinary services | Institutional | Infrequent technical advice, training and animal health care |
| C7 | Market access and prices | Market | Poor roads, few buyers and volatile producer prices |
| C8 | Credit and finance | No affordable loans, savings or insurance for start-up costs | |
| C9 | Post-harvest loss and storage | Production | Spoilage and lack of storage between harvest and sale |
| C10 | Insecurity and displacement | Institutional | Conflict, movement restrictions and displacement of household members |
| C11 | Land tenure and resource disputes | Disputes over farmland, water points and grazing | |
| C12 | Aid design and dependency | Aid that substitutes for production, e.g. unequal conditional and unconditional payments |
Note. Ratings are on a five-point scale (1 = not a problem, 5 = very serious). Domains support interpretation only and play no part in the optimisation.
Analytical model
The TURF selects, from m candidate items, the k-item line that appeals to the largest number of distinct consumers (Miaoulis et al., 1990). We transpose it to challenge assessment. A portfolio of challenges is a set S ⊆ J, and the mosteconomicalprogrammingprogramme is the portfoliothatmaximisesreach, because it omits any challenge whose affected households are already covered by others. Table 2 sets out the model in nine steps. The equations are native Word equations and can be edited directly.
| Step 1 Build the response matrix | Let households be indexed i = 1,…,n and the candidate challenges j ∈ J = {1,…,m}. Each household rates the severity of every challenge on a five-point scale. |
|---|---|
| Step 2 Binarise (top-two-box) | A challenge is treated as present for a household when its severity reaches the threshold c (primary analysis c = 4, i.e. “serious” or “very serious”). I(·) is the indicator function. |
| Step 3 Single-challenge prevalence | The conventional statistic: the share of households experiencing challenge j. It is retained as the baseline against which unduplicated reach is judged. |
| Step 4 Portfolio coverage indicator | For any portfolio S ⊆ J, household i is covered (“reached”) if it experiences at least one challenge in S, so a household facing several challenges is counted only once. |
| Step 5 Unduplicated reach | Reach is the proportion of households covered by S. A design-weighted version corrects for unequal village sampling fractions (w_i = N_v / n_v, the village population over the village sample). |
| Step 6 Frequency and duplication | Frequency is the mean number of the portfolio’s challenges borne by a reached household; it measures depth of burden. It equals the additive prevalence divided by reach. The duplication index D(S) is the amount by which additive prevalence overstates true coverage. |
| Step 7 Optimise the portfolio | For each size k, find the portfolio with maximum reach. Equivalently, solve the integer programme below, where y_j = 1 if challenge j is selected and z_i = 1 if household i is covered. |
| Step 8 Marginal reach and stopping rule | Marginal reach is the extra share of households covered when challenge j joins S. The recommended portfolio size k* is the smallest k whose reach attains a target ρ, or beyond which marginal gains fall below δ. A greedy algorithm is run as a check: submodularity guarantees it attains at least (1 − 1/e) ≈ 63% of optimal reach (Nemhauser et al., 1978). |
| Step 9 Inference and robustness | Resample households with replacement B = 2,000 times, recompute R(S) on each replicate b and report the percentile interval. Stability of the optimal set is the mean Jaccard similarity between the bootstrap optimum and S. The whole procedure is repeated for c = 3 and c = 5 and for each village and sex subgroup. |
Note. S = portfolio of challenges; J = full inventory; n = households; m = challenges; c = severity threshold; ρ, δ = analyst-set reach target and marginal-gain floor.
Table 3 uses six households and three challenges to show why ranking and reach can disagree. Drought (A) is the most prevalent challenge (66.7%), and irrigation constraints (B) are second (50.0%), so a ranking would pair them. But the three households with irrigation problems also have drought problems, so adding B to A reaches no new household. Credit constraints (C), though the least prevalent (33.3%), fall on exactly the two households that A misses, and the pair A + C reaches all six households (100%) against 66.7% for A + B. The frequency of A + C is 1.00, meaning there is no overlap, whereas A + B has a frequency of 1.75 and a duplication index of 50 percentage points.
| Household | A: Drought | B: Irrigation | C: Credit | z(A, B) | z(A, C) |
|---|---|---|---|---|---|
| H1 | 1 | 1 | 0 | 1 | 1 |
| H2 | 1 | 1 | 0 | 1 | 1 |
| H3 | 1 | 1 | 0 | 1 | 1 |
| H4 | 0 | 0 | 1 | 0 | 1 |
| H5 | 0 | 0 | 1 | 0 | 1 |
| H6 | 1 | 0 | 0 | 1 | 1 |
| Prevalence / reach | 66.7% | 50.0% | 33.3% | R = 66.7% | R = 100% |
Note. A + B: Σp = 116.7%, F = 1.75, D = 50.0 points. A + C: Σp = 100%, F = 1.00, D = 0 points.
With m = 12 the number of candidate portfolios of size k is C(12, k): 220 for k = 3, 495 for k = 4 and 792 for k = 5. Exhaustive enumeration is therefore trivial and guarantees the global optimum, and the greedy algorithm and the integer programme serve as cross-checks. Optimal portfolios are not necessarily nested, since the best set of three need not contain the best set of two, so each k is solved independently. Ties are resolved in favour of the portfolio with the higher mean severity among reached households and are reported. Qualitative material is then used to explain why particular challenges cover the same or different households, for example whether credit and market constraints co-occur because both reflect distance from the town.
Findings and Discussion
The survey was designed to examine aid and adoption and did not include a TURF-ready challenge module, so we do not claim empirical TURF results here. The researcher instead (i) reports descriptive signals from thedata that motivate the approach and (ii) demonstrates the outputs and interpretation using an analysis of 96 × 12 matrix with the study’s sample size, in which the inventory is built from two correlated clusters, a production-side cluster (C1–C5, C9) and an institutional-market cluster (C6–C8, C10–C12).
Descriptive results
Three signals from the 96-household survey indicate that a portfolio view is warranted. Extension services were reported available only to a little extent by 55.2% of respondents; market availability was rated little or none by 44.8%; and respondents and key informants described aid payment structures that appear to discourage cultivation. These weaknesses sit in different institutional domains, yet plausibly burden overlapping households, so their combined reach cannot be inferred from their separate percentages. The household profile, with one-third of respondents being women and over half having practised agro-pastoralism for five years or less, also suggests heterogeneity that a single pooled ranking would conceal.
The TURF output
In the data, 96.9% of households rated at least one challenge as serious (top-two-box), and the average household reported 5.4 of the 12. Drought (65.6%), irrigation and mechanisation (61.5%) and seed and inputs (58.3%) were the most prevalent individual challenges. Table 4 shows the optimal portfolio at each size, alongside the portfolio obtained by simply taking the k most prevalent challenges.
| k | TURF-optimal portfolio, S* | Reach R (%) | Frequency F | Additive Σp (%) | Reach of top-k by prevalence (%) |
|---|---|---|---|---|---|
| 1 | Drought | 65.6 | 1.00 | 65.6 | 65.6 |
| 2 | Drought, Credit | 83.3 | 1.41 | 117.7 | 76.0 |
| 3 | Irrigation, Market access, Credit | 88.5 | 1.80 | 159.4 | 80.2 |
| 4 | Drought, Irrigation, Market access, Credit | 92.7 | 2.43 | 225.0 | 89.6 |
| 5 | Drought, Irrigation, Extension, Market access, Credit | 94.8 | 2.84 | 268.8 | 89.6 |
| 6 | Drought, Irrigation, Extension, Market access, Credit, Land disputes | 95.8 | 3.05 | 292.7 | 92.7 |
Note. Reach and frequency follow Steps 5–6 of Table 2 with c = 4. The bootstrap 95% interval for R at k = 3 is 82.3–93.8%. The greedy algorithm matches the optimum reach at k = 3 and k = 4.
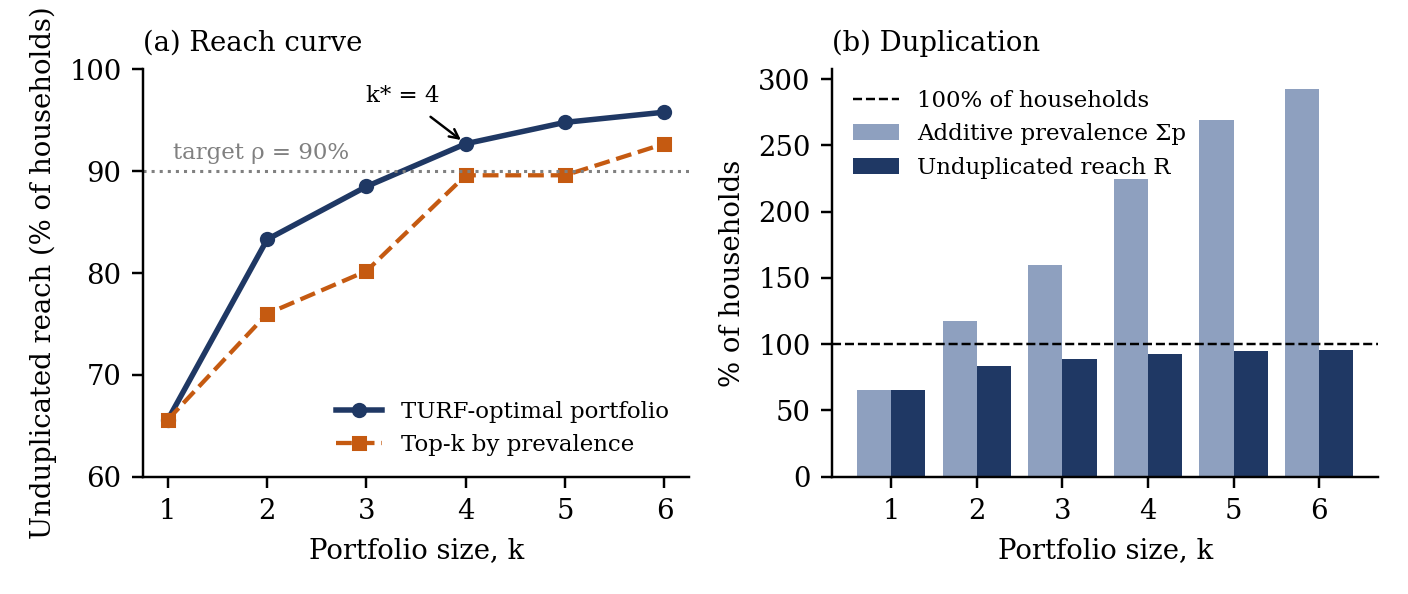
Additive prevalence overstates coverage:At k = 2, the prevalences of drought and credit sum to 117.7%, an impossible figure for a population share; true reach is 83.3%, and the duplication index is 34.4 percentage points. By k = 6, additive prevalence reaches 292.7% against a reach of 95.8%. This is the quantitative form of the first weakness of ranking identified in Section 1.
The optimal set is not the most prevalent set: At k = 3, the optimal portfolio reaches 88.5% (95% CI 82.3–93.8) against 80.2% for the three most prevalent challenges, a gain of 8.3 points. Notably, the optimal three omit drought, the most prevalent challenge, because drought-affected households largely overlap with those facing irrigation constraints, whereas credit and market access reach households in the other cluster. Portfolios are not nested, so a programme that begins with the top-ranked challenge may foreclose the most efficient package, and sizing and sequencing should be read from the whole reach curve.
Reach saturates and frequency measures depth: Reach rises steeply to k = 4 (92.7%), after which each added challenge contributes only 2.1 and 1.0 points. With ρ = 90% or δ = 2.5 points, Step 8 would therefore recommend k* = 4. Frequency rises from 1.00 to 3.05 over the same range, showing that the households covered by larger portfolios are increasingly multi-burdened. A high F for a small portfolio flags compound vulnerability that single-sector interventions will not resolve, and suggests integrated packages (for instance, input credit combined with market linkage) over stand-alone projects.
Heterogeneity and niche challenges:Running Steps 4–9 by village and sex will show whether a challenge such as insecurity, land disputes or distortionary aid design, which has modest overall prevalence, contributes disproportionate marginal reach in particular groups. Such niche but non-overlapping challenges are invisible to ranking but emerge naturally from marginal-reach analysis (Step 8), and the qualitative aspect can explain them.
Integrating the qualitative data
The mixed-methods design gains its value at the interpretation stage. The TURF indicates where challenges overlap or diverge; the interviews and focus groups indicate why. Table 5 is the joint display that structures this integration, pairing each type of quantitative signal with the qualitative probe used to interpret it and the decision it informs.
| Quantitative TURF signal | Qualitative probe (KII and FGD) | Interpretive use |
|---|---|---|
| High duplication D(S) between two challenges | Do the same households face both, and why (distance, asset poverty, clan access to land or water)? | Distinguish a shared root cause from coincidence; justify an integrated package |
| Low prevalence but high marginal reach ΔR | Which households or groups are affected (women, newly settled, displaced)? | Define targeting criteria so that niche challenges are not dismissed |
| Optimal portfolio differs from top-k by prevalence | Are omitted challenges already addressed by other programmes? | Confirm that omission reflects redundancy, not neglect, before reallocating |
| Reach plateau at k* | Are the remaining challenges seasonal or localised? | Decide whether to stop at k* or add a targeted component |
| Divergence by sex or village | Sex-segregated focus-group accounts of constraints | Design differentiated packages and verify women’s voice |
Note. KII = key informant interview; FGD = focus group discussion.
Adoption studies explain why individual farmers adopt or reject technologies (Mamudu et al., 2012; Ogada et al., 2014), and work on food aid examines its effect on production incentives (Gelan, 2007; Gilligan & Hoddinott, 2007). Both treat constraints one at a time or in a regression where overlap is a nuisance (collinearity) and not an object of study. TURF complements them by making overlap the object: it tells planners which constraints, in what combination, must be addressed to touch most households, and which are redundant for the purpose of coverage. It does not replace causal analysis, since it describes co-occurrence and not effect, but it narrows the set of constraints that deserve causal evaluation.
Three implications follow. First, for programme design, the reach curve answers a question that rankings cannot: how many constraints must be tackled before additional effort yields little additional coverage. Where the curve plateaus early, a compact and integrated package is justified, and where it climbs slowly, a broad suite or geographic targeting is needed. Second, for aid design, if aid distortion is shown to add reach beyond agro-ecological and market constraints, the evidence would support revisiting conditionality and payment structures and not simply increasing volumes, a point central to the sustainability debate in Beletweyne. Third, for monitoring, the challenge module is short enough to be embedded in routine household surveys, so the portfolio and its reach can be re-estimated each season, turning TURF from a one-off study into a tracking indicator of whether the burden on households is narrowing.
Conclusion
Agro-pastoral households in Beletweyne face overlapping, rather than separate, constraints, and conventional ranking cannot capture that overlap. This article specifies a TURF-based model that treats challenges as a portfolio, identifies the minimum combination that reaches the largest unduplicated share of households, and reports how heavily those challenges co-occur. The nine-step procedure is fully reproducible, uses exhaustive optimisation for global optimality, and quantifies uncertainty and robustness, which matters in small-sample fragile-state research. The demonstration shows that additive prevalence can overstate coverage several-fold, that the most prevalent challenges need not form the most efficient set, and that reach saturates at a small portfolio size, giving a defensible rule for how many problems a programme should attempt to solve at once.
What is novel
A new analytical lens for livelihood constraints. To this article’s knowledge, this is the first specification of TURF for assessing the challenges of agro-pastoral households, moving the field from additive ranking to portfolio logic.
Two-dimensional measurement of burden. Reach (breadth) and frequency (depth), with the duplication index D(S) and marginal reach ΔR, jointly describe how widely and how deeply challenges fall on households, which no single prevalence statistic can do.
An inversion of a marketing tool for fragile-state research. Recasting households as consumers and challenges as products converts a commercial optimiser into a prioritisation tool for humanitarian and development planning.
A reproducible, inferential protocol. The nine steps combine integer optimisation, a greedy guarantee, weighted reach, bootstrap intervals and threshold and subgroup sensitivity, with qualitative validation of the inventory and interpretation of the results.
Evidence for sequencing aid. The reach curve and stopping rule give donors and ministries a transparent criterion for deciding how many constraints to target and which to drop as redundant.
Limitations and Future Research
The design is cross-sectional and relies on self-reported severity over two seasons, so recall error and strategic reporting are possible, especially where respondents anticipate aid. Third, binarisation at c = 4 discards information on intensity, although sensitivity at c = 3 and c = 5 mitigates this. Fourth, a sample of 96 gives only ±10% precision, so bootstrap intervals will be wide and optimal portfolios of similar reach may be statistically indistinguishable; ties should be reported and not over-interpreted. Fifth, women are one-third of the sample, and village and sex weights cannot fully correct unobserved differences. Sixth, TURF treats all challenges as equally costly to address and describes co-occurrence, not causation, so reach is not the same as impact. Seventh, the inventory is finite,soit cannot include omitted challenges, and a single district limits external validity. Future work should apply TURF to panel data across drought and flood years, extend it to a cost-weighted or budget-constrained form, incorporate spatial information on villages and water points, and test whether portfolios chosen by reach also produce the largest gains in food security.
References
Rights and permissions

Disclaimer
All claims expressed in this article are solely those of the author and do not necessarily represent those of the publisher, editors, reviewers, or affiliated institutions. Any product, service, or claim that may be evaluated in this article is not guaranteed or endorsed by the publisher.
Publisher’s note
The publisher remains neutral with regard to jurisdictional claims.
Additional information
Data availability
The data supporting the findings of this study are available from the corresponding author upon reasonable request.
Funding
This research received no specific grant from any funding agency in the public, commercial, or not-for-profit sectors.
Article Timeline
 Publication record
Cite this article
- Received
- August 17, 2026
- Revised
- September 15, 2026
- Accepted
- October 7, 2026
- Published
- October 22, 2026
- Version of record
- October 22, 2026
Share this article
Share the article record with colleagues and readers worldwide.
Explore research across our journalsDiscover more research

Recent Publications

Most Read

Recommended
Save this article as a bookmark
Use your browser’s secure bookmark shortcut. Both desktop options are shown below.
Press Ctrl+D
In Chrome, Edge or Firefox, choose a folder if needed, then select Done.
Press ⌘ Command+D
In Safari, Chrome or Firefox, choose the bookmark location and confirm.
Cite this article
Copy a formatted citation or download a reference file.
Cited by
Crossref citation count for this DOI.