

Analysis of Crop Production Choices among Agro-Pastoral Households in Beletweyne, Somalia


Abstract
Crop choice is the first and most consequential decision an agro-pastoral household makes each season, yet it is usually explained by agronomic suitability or input availability. This article applies Rogers’ Diffusion of Innovations Theory to explain why households in Beletweyne District, Somalia, adopt or reject crop options promoted through aid and extension. We operationalise the theory’s five perceived attributes of innovations (relative advantage, compatibility, complexity, trialability and observability), its five-stage innovation-decision process, communication channels and adopter categories, and combine them in a nine-step model comprising a stage funnel, binary and multinomial logit estimation, adopter-category classification and a Bass diffusion curve. The design builds on a mixed-methods survey of 96 households in three villages, supplemented by 10 key-informant interviews and four focus-group discussions. Descriptive signals from the survey show abundant financial aid (mean 4.98 of 5) but thin extension (mean 2.85), a configuration the theory predicts will stall adoption at the knowledge and persuasion stages. Analysis shows how the outputs are read. The article offers a theory-to-estimation protocol for crop-choice research in fragile settings.
Introduction
Agro-pastoral households in central Somalia take a sequence of crop decisions each year that determine whether livestock income is cushioned by food from the field. Along the Shabelle River in Hiiraan Region, households farm irrigated plots (maize, sorghum and beans) and rain-fed plots (sesame, known locally as simsim, and maize), planting with the Gu (April–June) and Deyr (October–December) rains while keeping cattle, goats, sheep and camels whose sale finances seed, labour and hired tractor hours (Catley et al., 2013). Beletweyne District, the setting of this article, illustrates the system in three villages: Hodan, Buunda Weyn and Hawa-tako. Which crop a household plants, whether it stays with a familiar sorghum or maize landrace or tries an improved short-maturing variety, a cash crop or a drought-tolerant legume, determines its exposure to drought, flood and price shocks. Maystadt and Ecker (2014) show that in Somalia climatic shocks travel through livestock markets into conflict, which raises the stakes of household livelihood decisions.
The puzzle motivating this article is that crop options and the resources to plant them have been supplied, yet crop portfolios have not obviously changed. In the survey of 96 households, respondents rated financial aid as the strongest factor in agricultural development (mean 4.98 on a five-point scale, SD 0.20), whereas the availability of extension services scored lowest (mean 2.85, SD 0.97), and 55.2% said extension was available only to a lesser extent. A regression reported in article found no significant association between adoption and crop production (F = 0.408 against a tabulated 2.17). Key informants also described aid designs in which beneficiaries were paid USD 150 weekly to cultivate but USD 90 for not cultivating, with many reportedly choosing the lower sum. Supply, in other words, appears to have outrun the processes by which households come to know, evaluate and trust a new crop.
Adoption research since Griliches’s (1957) study of hybrid corn has documented S-shaped diffusion paths and related adoption to profitability, information, risk and household endowments (Feder et al., 1985; Kassie et al., 2013). Two strands are relevant here. The first, developed from Rogers (2003), holds that adoption depends on how potential adopters perceive an innovation: its relative advantage, compatibility, complexity, trialability and observability. Adesina and Zinnah (1993) showed that farmers’ perceptions of the characteristics of improved rice varieties shaped adoption in Sierra Leone, and Moore and Benbasat (1991) built a validated instrument for measuring such perceptions. The second strand stresses learning through social networks: farmers update their beliefs from neighbours’ experience (Conley & Udry, 2010), and the adoption decisions of network members influence whether a new crop is taken up (Bandiera & Rasul, 2006). Rarer is analysis of crop choice in a Somali agro-pastoral system that uses the theory as an integrated model, linking perceived attributes, decision stage, communication, and timing, and estimating them together.
Diffusion of Innovations Theory defines diffusion as the process by which an innovation is communicated through certain channels over time among members of a social system (Rogers, 2003). Four elements follow: the innovation itself; the communication channels; time, which appears in the innovation-decision process (knowledge, persuasion, decision, implementation and confirmation), in adopters’ innovativeness and in the rate of adoption; and the social system. In this article, the “innovation” is any crop or variety that the household had not planted before it was promoted by aid agencies or extension workers, for example, improved short-maturing maize or sorghum seed, sesame as a cash crop, or cowpea as a drought-tolerant legume.
This article claims that crop choice among agro-pastoral households is best understood as an innovation-decision, and that the perceived attributes of crop options and the channels through which households learn about them explain adoption better than the mere availability of seed and funds. If this is correct, aid that raises availability without changing perceptions and communication will leave crop portfolios largely unchanged, which is the pattern suggested by the survey. Thus, the objective of this article is to assess, using Diffusion of Innovations Theory, how the perceived attributes of crop innovations and the stage of the innovation-decision process explain crop production choices among agro-pastoral households in Beletweyne District.
Methods
Study area
The study area is Beletweyne District in the Hiiraan Region of central Somalia, bordering Ethiopia and traversed by the Shabelle River, which divides the regional capital, Beledweyne. The district is inhabited mainly by the Hawadle community and comprises two production zones: irrigated or flood-recession farmland and rain-fed land beyond the river’s reach. Rainfall is bimodal, with the Gu and Deyr rains separated by the dry Hagaa and Jilaal seasons, so farmers must repeatedly choose crops under uncertainty. Irrigated plots grow maize, sorghum and beans; rain-fed plots grow sesame and maize, and livestock complement crop income. The villages of Hodan, Buunda Weyn and Hawa-tako were selected because they receive concentrated agricultural aid in the form of seed, fertiliser, tractor hours and training, so crop innovations have been actively promoted, a precondition for studying diffusion. Security conditions in Hiiraan are fragile and shaped fieldwork logistics.
Research design
The study is a cross-sectional, theory-driven (deductive) survey in the descriptive tradition used in the article (Mugenda & Mugenda, 2003), embedded in a convergent mixed-methods design (Creswell & Plano Clark, 2018). The quantitative strand measures the constructs of Diffusion of Innovations Theory and estimates the model in Section 2.5. The qualitative strand, comprising key informant interviews, focus group discussions and field observation, has two functions: before fieldwork it confirms the set of crop innovations and the wording of the attribute items, and afterwards it explains why attributes and stages relate to adoption as they do. The unit of analysis is the household’s decision regarding crop innovations, and the unit of observation is the household head or principal decision-maker. Retrospective questions on the season of first planting allow the diffusion path to be reconstructed from a single survey, although a cross-section cannot observe decisions as they unfold; this limitation is discussed in Section 5.
Participants and sampling
The target population comprised rain-fed and riverine agro-pastoral households in the three villages, defined, as in the survey, as households deriving over 50% of income from farming and 10–50% from livestock. Simple random sampling gave each household a known and equal chance of selection (Black, 2014). The sample size was computed with Cochran’s (1977) formula for a proportion at 95% confidence, maximum variability (p = 0.5) and a ±10% margin of error:
Ninety-six households were allocated as 30 (Hodan), 33 (Buunda Weyn) and 33 (Hawa-tako). Of these respondents, 64 (66.7%) were male and 32 (33.3%) female; 45.8% had secondary education, 41.7% a diploma and 12.5% a bachelor’s degree; and 54.2% had practised agro-pastoralism for one to five years, 29.2% for more than five years and 16.7% for under one year. Ten key informants (officers responsible for agriculture and pastoralism) were interviewed, and four focus-group discussions were held, two with men and two with women. A logistic model needs enough adopters per estimated parameter; with roughly 40% expected adopters (about 38 events), the model is limited to eight predictors and uses penalised estimation as a safeguard (Peduzzi et al., 1996; Firth, 1993).
Data collection procedures
Data collection followed an authorisation letter from the university and permission from local authorities. Trained Somali-speaking enumerators administered the questionnaire face-to-face after oral informed consent, assuring anonymity and stating that participation would not affect eligibility for aid. The instrument had four parts: (A) household characteristics; (B) a crop-innovation history in which, for each crop innovation, the respondent reported whether they knew of it, formed a favourable view, decided to plant it, planted it in the last two seasons and continued after the first season, together with the season of first planting; (C) fifteen agreement items, three per attribute, rated on a five-point scale (Table 1), adapted from Moore and Benbasat (1991) and Adesina and Zinnah (1993); and (D) the communication channels through which the respondent had heard of or seen the crop. An academic supervisor and food-production specialists checked the items for content validity, and a pilot with 10% of the sample, excluded from the final analysis, tested comprehension and timing. Internal consistency of each three-item attribute scale was assessed with Cronbach’s alpha at a 0.70 threshold, and items were revised where a scale fell short. Interviews and discussions were recorded with permission, transcribed and coded thematically (Braun & Clarke, 2006), and observation notes recorded planting practices and aid-distribution events. Data were entered and cleaned in SPSS and analysed in R or Python.
| Construct | Definition (after Rogers, 2003) | Crop-specific items (agreement, 1–5) |
|---|---|---|
| Relative advantage | Degree to which the innovation is seen as better than the crop it replaces | Gives higher income or yield than my usual crop; lowers the risk of total failure in a poor season; worth the extra cost |
| Compatibility | Consistency with existing values, experiences and needs | Fits our food preferences and seasonal calendar; fits with moving or tending livestock; consistent with how land and water are shared |
| Complexity | Perceived difficulty of understanding and using it | Seed handling and planting are difficult; pest and water management are hard to get right; I need help to grow it |
| Trialability | Degree to which it can be tried on a limited basis | I could plant a small plot first; seed is available in small quantities; I can stop after one season at little loss |
| Observability | Visibility of its results to others | I have seen neighbours’ harvests of it; results are easy to see and compare; farmers talk about it |
| Communication channels | Means by which messages about the innovation reach adopters | Count of channels used (0–4): extension agent, NGO demonstration or training, neighbours and relatives, radio or mobile phone |
| Time | Stage reached, earliness of adoption and rate of adoption | Furthest stage reached (knowledge to confirmation); season of first planting counted from first promotion |
| Social system | Structure within which diffusion occurs | Village, sex and education of the respondent (controls); focus-group accounts of norms and opinion leaders |
Note. Complexity is scored so that higher values mean more complex; a negative association with adoption is therefore expected.
Analytical model
The model translates the theory into estimable quantities. The dependent variable is whether the household has planted at least one crop innovation in the last two seasons (implementation stage), and, for the portfolio model, which of four crop-portfolio categories the household follows. The theory yields directional expectations that are stated in advance: relative advantage, compatibility, trialability and observability are expected to raise the odds of adoption (H1, H2, H4, H5), complexity to lower them (H3), and a larger number of communication channels to raise them (H6). A further proposition (H7) is that, where extension is thin, leakage in the funnel will be largest at the knowledge and persuasion stages. Table 2 sets out the nine steps; the equations are native Word equations and can be edited directly.
| Step 1 Score the perceived attributes | For each household i and attribute k ∈ {RA, CO, CX, TR, OB} (relative advantage, compatibility, complexity, trialability, observability), average the mk agreement items aikl and standardise, so that coefficients are read per one standard deviation. |
|---|---|
| Step 2 Map the innovation-decision funnel | Each household is classified by the furthest stage Si reached (1 knowledge, 2 persuasion, 3 decision, 4 implementation, 5 confirmation). Ns counts households reaching stage s or beyond, cs is the stage-to-stage conversion rate (N0 = n) and Ls is the leakage, which locates where adoption stalls. |
| Step 3 Estimate the adoption model (binary logit) | Yi = 1 if the household planted at least one crop innovation in the last two seasons (implementation stage). The linear index combines the attribute scores, the count of communication channels CHi and controls Wi (sex, education). |
| Step 4 Interpret: odds ratios and marginal effects | The odds ratio gives the multiplicative change in the odds of adoption per standard deviation of attribute k. The average marginal effect (AME) converts it to percentage points of adoption probability, with p̂i the fitted probability. |
| Step 5 Model the crop portfolio (multinomial logit) | Households fall into one of J crop-portfolio categories Ci (sorghum-based as reference, maize-based, sesame or cash-crop-based, legume-mixed). The same covariates explain which crop innovation is chosen, not only whether one is adopted. |
| Step 6 Classify adopter categories | Among adopters, ti is the season of first planting counted from the crop’s first promotion. Following Rogers, innovativeness classes are cut at the mean t̄ and standard deviation s, giving innovators, early adopters, early majority, late majority and laggards, with benchmark shares of 2.5, 13.5, 34, 34 and 16%. |
| Step 7 Fit the diffusion curve (Bass model) | The share of adopters over time follows an S-curve driven by an innovation coefficient p (external influence, e.g. aid agencies) and an imitation coefficient q (social contagion). The ratio q/p shows whether diffusion is externally pushed or socially pulled. |
| Step 8 Assess fit and small-sample safeguards | McFadden’s pseudo-R² compares the fitted and null log-likelihoods. With few adopters, Firth’s penalised likelihood (adding half the log-determinant of the information matrix) is used to reduce small-sample bias and separation. |
| Step 9 Inference and robustness | Heteroskedasticity-robust (HC3) standard errors and B = 1,000 bootstrap resamples give percentile intervals for each odds ratio. Multicollinearity among attribute scores is checked with variance inflation factors, and results are repeated with attributes as top-box indicators and by village and sex. |
Note. Si = furthest stage reached; Yi = adoption indicator; CHi = number of communication channels; Wi = controls; J = number of crop-portfolio categories; t = seasons since first promotion; p, q = Bass innovation and imitation coefficients.
Decision rules: Primary inference rests on the adoption model of Step 3 at a 5% significance level, with odds ratios reported alongside bootstrap intervals because the sample is small. Attribute scores enter together because they are theoretically distinct but empirically correlated, and a variance inflation factor above 5 triggers dropping or combining items. Where the logit model shows separation or very few adopters, the Firth estimator replaces ordinary maximum likelihood. The funnel, adopter categories and diffusion curve are descriptive devices: they locate where and when adoption stalls, whereas the logit models explain who adopts.
Findings and Discussion
Descriptive Analysis
The data point to an imbalance between resources and communication, which the theory treats as the heart of diffusion. Financial aid was the highest-rated factor (mean 4.98, SD 0.20), whereas availability of extension services was the lowest (mean 2.85, SD 0.97), and 55.2% of respondents said extension was available only to a lesser extent. Yet 49.0% agreed very much, and a further 35.4% agreed greatly that training and seminars are provided. Taken together, one-off events seem to be common while sustained, crop-specific advice and peer demonstration are not; the survey cannot separate the two, which is why the diffusion module measures channels and stages directly. In Rogers’ terms, funds and seed address the decision and implementation stages, whereas the thin extension channel starves knowledge and persuasion. The reported absence of a significant association between adoption and crop production (F = 0.408 against 2.17) is consistent with adoption that is shallow or short-lived, which the confirmation stage of the model is designed to detect.
Innovation-decision funnel
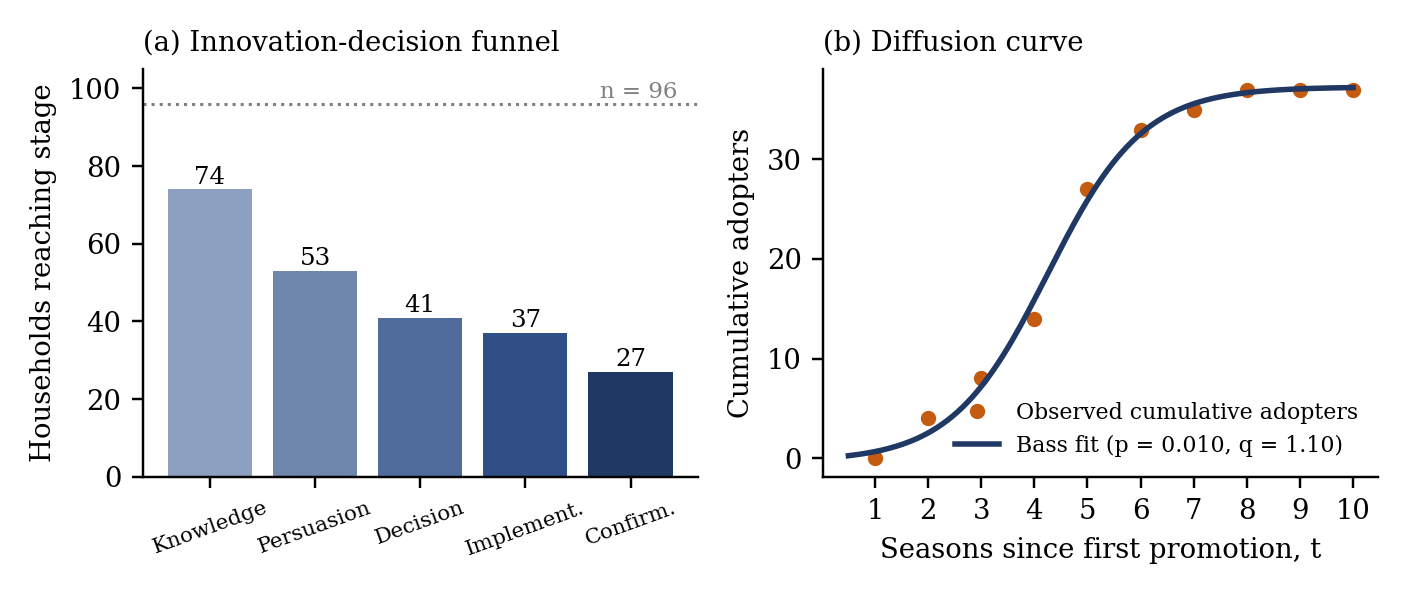
In data, 74 of 96 households (77.1%) knew of at least one crop innovation, 53 (55.2%) formed a favourable view, 41 (42.7%) decided to plant, 37 (38.5%) did so in the last two seasons, and 27 (28.1%) confirmed by continuing (Table 3, Figure 1a). Leakage is concentrated before the decision (22.9% at knowledge and 28.4% at persuasion) and after planting (27.0% at confirmation), while little is lost between decision and implementation (9.8%). That pattern is what H7 anticipates: once a household has decided, aid-supplied seed makes planting easy, but households fall away when they have not heard of the crop, are not persuaded by it, or are disappointed after the first season.
| Stage, s | Households Ns | Share of sample (%) | Conversion cs (%) | Leakage Ls (%) |
|---|---|---|---|---|
| 1. Knowledge | 74 | 77.1 | 77.1 | 22.9 |
| 2. Persuasion | 53 | 55.2 | 71.6 | 28.4 |
| 3. Decision | 41 | 42.7 | 77.4 | 22.6 |
| 4. Implementation | 37 | 38.5 | 90.2 | 9.8 |
| 5. Confirmation | 27 | 28.1 | 73.0 | 27.0 |
Note. Conversion is relative to the previous stage (stage 1 relative to n = 96), following Step 2 of Table 2.
Adopter categories and the diffusion curve
Among the 37 adopters, the mean season of first planting was 4.73 (SD 1.56), counted from first promotion. Table 4 applies Rogers’ cut-points. The distribution departs from the theoretical benchmark: no household qualifies as an innovator, early adopters (21.6%) are more numerous than the benchmark, and the late majority (51.4%) is larger than expected. This lumpy shape is typical of aid-driven diffusion, in which adoption clusters in the seasons when seed is distributed and not in a smooth, socially driven sequence. The fitted Bass curve gives an innovation coefficient of p = 0.010 and an imitation coefficient of q = 1.10, a ratio of about 110, and a market potential of 37 adopters. Diffusion in these findings is therefore overwhelmingly socially driven: cumulative adopters rise from 14 to 33 between seasons 4 and 6 as households observe and imitate others, a pattern that mirrors the S-curves described by Griliches (1957) and Bass (1969).
| Category | First planting, t (seasons) | Households | Share (%) | Rogers benchmark (%) |
|---|---|---|---|---|
| Innovators | < 1.62 | 0 | 0.0 | 2.5 |
| Early adopters | 1.62 – 3.16 | 8 | 21.6 | 13.5 |
| Early majority | 3.17 – 4.72 | 6 | 16.2 | 34.0 |
| Late majority | 4.73 – 6.28 | 19 | 51.4 | 34.0 |
| Laggards | ≥ 6.29 | 4 | 10.8 | 16.0 |
Note. Cut-points are t̄ − 2s, t̄ − s, t̄ and t̄ + s with t̄ = 4.73 and s = 1.56 (Step 6 of Table 2).
Determinants of adoption
Table 5 reports the adoption model. Compatibility has the largest odds ratio (2.47 per standard deviation), followed by the number of communication channels (2.12), relative advantage (2.07) and observability (2.02), while complexity lowers the odds (0.46). Translated into probabilities, a one-standard-deviation increase in compatibility raises the chance of adoption by about 13 percentage points, relative advantage by about 11 and observability by about 10, and a one-standard-deviation rise in complexity lowers it by about 11. Trialability has no discernible effect (OR = 1.10), which is plausible where seed is distributed free: if everyone can try the crop at no cost, trialability stops discriminating between households. Sex and education are not significant. Fit is acceptable (McFadden R² = 0.33; AUC = 0.86), but bootstrap intervals are wide (for example, 1.24–12.63 for compatibility) because only 37 households adopt, giving fewer than the ten events per predictor that is usually recommended (Peduzzi et al., 1996).
| Predictor | OR | 95% CI (HC3) | p | Bootstrap 95% CI | AME (pts) |
|---|---|---|---|---|---|
| Relative advantage | 2.07 | 1.21 – 3.54 | .008 | 1.26 – 5.91 | +10.6 |
| Compatibility | 2.47 | 1.08 – 5.62 | .031 | 1.24 – 12.63 | +13.1 |
| Complexity | 0.46 | 0.25 – 0.84 | .012 | 0.15 – 0.74 | −11.3 |
| Trialability | 1.10 | 0.67 – 1.79 | .708 | 0.53 – 2.23 | +1.4 |
| Observability | 2.02 | 1.09 – 3.76 | .026 | 1.21 – 7.23 | +10.2 |
| Communication channels | 2.12 | 1.15 – 3.88 | .015 | – | – |
| Female | 0.74 | 0.20 – 2.77 | .657 | – | – |
| Diploma or above | 0.52 | 0.18 – 1.52 | .234 | – | – |
Note. 37 adopters among 96 households; attribute scores standardised, so odds ratios are per one standard deviation; McFadden R² = 0.33, AUC = 0.86. AME = average marginal effect in percentage points of adoption probability (Step 4).
The statistical pattern says which perceptions matter; the interviews and focus groups say why. Table 6 is the joint display that pairs each quantitative signal with the qualitative probe used to interpret it and the decision it informs. For example, a strong compatibility effect would send the analyst to women’s and men’s focus groups to learn which dietary, seasonal or herd-movement conflicts make a crop a poor fit, and the answer would shape the choice of variety and planting window.
| Quantitative signal | Qualitative probe (KII and FGD) | Interpretive use |
|---|---|---|
| Strong compatibility effect | Which dietary, seasonal or herd-movement conflicts make the crop a poor fit? | Choose varieties and planting windows that fit the crop calendar and mobility |
| Strong observability effect | Where do households see neighbours’ harvests, and whom do they trust? | Site demonstrations on respected farmers’ plots |
| Complexity lowers adoption | Which steps (seed handling, pests, water) are hardest, and who helps? | Targeted training with follow-up visits |
| Leakage at persuasion and confirmation | Why do households stop after one season (yield, price, payment design)? | Align aid payments with cultivation; add follow-up support |
| Trialability has no effect | Does free seed remove the need to trial a crop? | Treat as a supply effect, not as evidence trials are unimportant |
Note. KII = key informant interview; FGD = focus group discussion.
Classic adoption studies explain uptake through farm size, risk, information and endowments (Feder et al., 1985) and through the interdependence of practices (Kassie et al., 2013). The present framework does not displace them; it adds a behavioural layer in which the perceived attributes of a crop, and not only its objective profitability, determine the decision (Adesina & Zinnah, 1993), and in which diffusion proceeds through social channels (Conley & Udry, 2010; Bandiera & Rasul, 2006). Three implications follow. First, supply should be matched by communication: demonstration plots, farmer-to-farmer exchange and sustained extension address observability, compatibility and complexity, the attributes that matter most in the analysis. Second, aid design matters for confirmation: payment structures that reward not cultivating undermine the very continuation the confirmation stage measures. Third, because imitation dominates, early adopters are the natural entry point; identifying and supporting them is cheaper than reaching every household directly. Rogers himself noted that the theory carries a pro-innovation bias and underplays structural constraints such as land tenure and capital, so the model includes controls and the qualitative strand probes constraints that perceptions cannot explain.
The central claim is falsifiable. It would be weakened if the perceived attributes and communication channels added little explanatory power once availability-related variables (receipt of seed or funds, access to irrigation) were entered, or if aid receipt alone predicted adoption and the stage at which households stall. Four checks are planned: re-estimating with attributes coded as top-box indicators instead of standardised scores; replacing the binary outcome with an ordered logit on the furthest stage reached, which uses all five stages; estimating the models separately by village and sex to test whether effects are stable; and a placebo test in which the attribute scores for a crop that was never promoted are used to predict adoption of promoted crops, which should show no association. Consistent results across these checks would support the interpretation that perceptions, and not unobserved household traits, drive crop choice.
Conclusion
This article specified a Diffusion of Innovations model for crop choice among agro-pastoral households in Beletweyne. It treats crop choice as an innovation-decision whose outcome depends on perceived relative advantage, compatibility, complexity, trialability and observability, on the channels through which households learn, and on the stage and timing of the decision. The nine-step model links each construct to a measurable indicator and an estimation step, from the stage funnel to the logit models and the Bass curve, and includes safeguards suited to small samples in fragile settings. The survey suggests a configuration in which funds are plentiful, but extension is thin, which the theory predicts will stall diffusion at knowledge and persuasion. The analysis shows how the model locates where adoption stalls, which perceptions drive it, and how fast it spreads.
What is novel
- An integrated theory-to-estimation model. To our knowledge, this is the first specification of the full Diffusion of Innovations model, covering attributes, stages, channels, adopter categories and the diffusion curve, for crop choice among Somali agro-pastoralists.
- From who adopts to where adoption stalls. The stage funnel with conversion and leakage rates shifts attention from the identity of adopters to the stage at which aid-promoted crops lose households, a diagnostic that a single adoption regression cannot give.
- Perceptions and timing in one design. Odds ratios on perceived attributes explain who adopts, while the Bass coefficients p and q explain how fast and by what mechanism (external push or social pull) diffusion occurs.
- A resource-communication diagnosis of aid. Pairing the aid-versus-extension imbalance with the funnel offers a testable explanation of why abundant supply has not shifted crop portfolios.
- Small-sample safeguards and a mixed-methods joint display. Robust and bootstrap inference, penalised likelihood, and a structured link between each statistical signal and a qualitative probe make the model usable in fragile-state field research.
Limitations and Future Research
The design is cross-sectional and the season of first planting is recalled, so recall error is likely and decisions cannot be observed as they unfold. Third, perceptions are measured after adoption, so adopters may rate attributes more favourably because they adopted (reverse causality); a panel design measuring perceptions before the decision would address this. Fourth, 96 households and a modest number of adopters mean fewer events per predictor than recommended (Peduzzi et al., 1996), and the three villages are too few for cluster-robust inference, so estimates are imprecise and rely on penalised estimation and bootstrapping. Fifth, three-item attribute scales and self-reported stages are susceptible to social desirability and to expectations of aid. Sixth, the set of crop innovations is defined by what aid agencies promoted, so selection is partly supply-driven, and communication channels may themselves be endogenous to household characteristics. Seventh, Diffusion of Innovations Theory underweights structural constraints and carries a pro-innovation bias, and a single district limits external validity. Future work should follow households across seasons, use network data to identify who learns from whom, test demonstration and communication interventions experimentally, and extend the model with costs and risk preferences.
References
Rights and permissions

Disclaimer
All claims expressed in this article are solely those of the author and do not necessarily represent those of the publisher, editors, reviewers, or affiliated institutions. Any product, service, or claim that may be evaluated in this article is not guaranteed or endorsed by the publisher.
Publisher’s note
The publisher remains neutral with regard to jurisdictional claims.
Additional information
Data availability
The data supporting the findings of this study are available from the corresponding author upon reasonable request.
Funding
This research received no specific grant from any funding agency in the public, commercial, or not-for-profit sectors.
Article Timeline
 Publication record
Cite this article
- Received
- August 2, 2026
- Revised
- September 20, 2026
- Accepted
- October 9, 2026
- Published
- October 22, 2026
- Version of record
- October 22, 2026
Share this article
Share the article record with colleagues and readers worldwide.
Explore research across our journalsDiscover more research

Recent Publications

Most Read

Recommended
Save this article as a bookmark
Use your browser’s secure bookmark shortcut. Both desktop options are shown below.
Press Ctrl+D
In Chrome, Edge or Firefox, choose a folder if needed, then select Done.
Press ⌘ Command+D
In Safari, Chrome or Firefox, choose the bookmark location and confirm.
Cite this article
Copy a formatted citation or download a reference file.
Cited by
Crossref citation count for this DOI.