
Composite and Price-based Marketing for Oligopolistic Telco Market Leaders-A study on Safaricom Plc Direct Voice Call Segment


Abstract
This study examined Safaricom’s direct voice call segment on performance based on marketing techniques from 2011 through 2025.The study hypothesized that composite and price-based marketing predicted the segment’s performance over the study period at 95% CI. A case study research design, using secondary data was employed. Results showed that the company exhibited slower-than expected growth in selected voice performance metrics. Correlation analysis revealed a positive association between customer size and voice call revenue and a negative association with call pricing and voice usage metrics. Regression results reinforced these findings, indicating that composite voice promotions predicted monthly voice customers (R² = 0.7328: F[1,13] = 35.66, p < 0.05: [β=0.157, SE=0.101, p< .005]: expenditure on calls[R2=0.0802: F [1,13] = 1.130, p˃0.05: β=-0.417, SE=0.391, p˃ .005], and number of annual voice minutes [R2=0.104 F [1,13] = 1.530, p˃0.05 : β=-0.32, SE=0.26, p˃ .005], . Call pricing predicted customer size [R2=0.104: F [1,13] = 230.80, p<0.05: [β=1.13, SE=0.074, p< .005}, annual voice call revenue (R2=0.959: F [1,13] = 1.38, p>0.05: β=-0.11., SE=0.092, p> .005], expenditure on voice calls[R2=0.4934: F [1,13] = 12.66, p<0.05: β= 01.694., SE=0.476, p< .005} and annual voice minutes [R2=0.4164: F [1,13] = 10.99, p>0.05: β=-0.272., SE=0.0829, p> .005] Overall, the findings demonstrate that while voice call promotions effectively boost customer acquisition and revenue, they do not significantly increase individual customer spending or call duration, highlighting a shift toward cost-sensitive usage behaviour.
Introduction
Telecom voice call promotions blend economic theory and market evidence, creating a robust framework for their strategic role (Mwanzia, 2024). Utility Maximization Theory explains how consumers seek maximum value from telecom services. Promotions like free night calls, bonus minutes, or unlimited weekend calling align with user preferences, boosting perceived value and driving higher usage (Balaji & Senthilkumar,2024). On the other hand, Price Discrimination Theory guides telecoms to tailor promotions for diverse segments, offering off-peak discounts or student and rural-specific bundles to match pricing with willingness to pay, capturing more consumer surplus (Esteves & Resende, 2016). Additionally, Oreagba et al. (2021) posit that in competitive markets, Game Theory informs strategies, as telecoms craft promotions to counter rivals, attracting and retaining subscribers. At the same time, utility maximization and price elasticity theories suggest that lower prices and added incentives stimulate usage and increase overall demand among consumers (Raboy, 2017). Based on Sharkasi and Ndiaye (2021), effective application of these models permits informed response to diverse market needs and respond to change.
Empirical data from emerging markets shows that discounted call rates or bonus minutes’ spur subscriber growth, especially among price-sensitive users, while reducing churn by fostering loyalty (Mntande, 2021). In regions with limited internet, direct voice remains key in communication, and promotions expand penetration. In saturated telecom markets, where data services encroach, voice promotions slow the shift, preserving revenue (Ngure, 2024). Short-term promotions drive daily or weekly engagement, swaying user choice. Telecoms track success through metrics like call duration, customer feedback, and top-up increases post-promotion (Mntande, 2021). This interplay of consumer behavior theories and competitive dynamics supports clear outcomes: spikes in usage and retention (Ochieng, 2021). Voice call promotions are thus vital tools, enabling telecoms to navigate competition, boost engagement, and sustain relevance in dynamic markets.
Kenya’s telecom market is a battleground of dominance and disruption, with companies vying to create ecosystems that secure customer loyalty (Ngure, 2024). As of 2025, the sector accounted for about 6% of Kenya’s GDP, valued at $3.87 billion. Safaricom dominates with about 64% of mobile subscriptions, while competitors like Airtel Kenya, Jamii Telecom, and Telkom Kenya lag behind. Smaller players like Equitel and Zuku, focused on broadband, hold under 5% of the market. Kenya’s telco growth is fueled by soaring data demand, fintech integration, and rapid 4G/5G network expansion. To compete, firms deploy aggressive pricing and bundled services. Safaricom’s M-Pesa leads mobile money with a 90% share, though Airtel Money and T-Kash are gaining ground with lower fees and integrations. As voice revenue declines, operators shift to data, which grows 8% yearly, driven by fintech and digital tools. This study explores how Safaricom Plc’s innovative price and non-price promotion strategies have shaped its voice call segment performance over the past 15 years (2011–2025).
Methods
2.1 Research Design
This study employed a structured framework to investigate the impact of aggressive marketing strategies on telecommunications performance, using a case study approach centered on Safaricom Plc. The choice of Safaricom Plc was informed by its market leadership in Kenya’s telecommunication sector (Josephine, 2016)]. With about 50 million subscribers as of 2025 against Airtel Kenya’s 23 million, Safaricom Kenya commands a significant proportion of Kenya’s telecommunication market share, and ranks highly among the world’s most successful telecommunication firms . An examination of the impact of price-based and composite marketing strategies on a company's voice call performance elucidates the efficacy of these approaches in bolstering the performance of market leaders' voice call services, particularly in the context of the prevailing decline in voice call demand in favor of alternative communication modalities.
This research adopted a case study design, leveraging secondary data to examine how aggressive marketing strategies influence Safaricom Plc’s voice call performance from 2010 through 2025. This design was selected for its ability to provide in-depth contextual analysis of marketing practices and their measurable impact on performance outcomes (Smith, 2015). Quantitative information on direct voice call served as the primary metric for assessing performance, yielding evidence-based insights into the relationship between marketing trends and business success. The case study approach is particularly suitable given Safaricom Plc’s position as a leader in the telecom industry in Kenya, enabling a detailed exploration of how its marketing strategies correlate with key performance indicators in the data sales segment (Ngure, 2024).
2.2. Data Sources
The study relies on secondary data from credible, publicly available sources, including Safaricom Plc’s annual reports, industry research reports, marketing campaign archives, and publications from the Communications Authority of Kenya (CA) and other regulatory bodies. These sources were compiled into a comprehensive dataset encompassing both financial and non-financial performance indicators, such as data sales revenue trends, pricing changes, subscriber growth patterns, and marketing expenditures. Where data gaps existed, supplementary reports from reputable market research organizations like IPSOS and Statista and peer-reviewed journal articles on telecom marketing and competitiveness were utilized. In cases of significant data absence, simulation techniques were applied to estimate missing values.
2.3. Data Collection Procedure
Data were systematically gathered from Safaricom’s official website, stock exchange filings, and public databases like CAK reports, GSMA, and Statista. Archived media and online sources were also searched to collect information on data-related marketing activities, including campaign launches, promotional offers, and sponsorships. All data were organized chronologically (2014–2024) to enable trend and correlation analyses. To ensure accuracy and consistency, data were cross-verified across multiple sources whenever possible. Standardized measurement units and time periods were used to maintain comparability across datasets.
2.4. Data Analysis
Data were systematically gathered from Safaricom Plc’s official website, stock exchange filings, and public databases like Communication authority of Kenya reports, GSMA, and Statista. Archived media and online sources were also searched to collect information on Safaricoms’s data-related marketing activities, including campaign launches, promotional offers, and sponsorships. All data were organized chronologically (2011–2025) to facilitate relevant descriptive, correlation and regression analyses. To ensure accuracy and consistency, data were cross-verified across multiple sources whenever possible (Godler & Reich, 2017). Standardized measurement units and time periods were used to maintain comparability across datasets as suggested by Welk (2019). Where data was completely absent, the study used simulation method to fill the gaps.
Findings
The findings present descriptive statistics to summarize trends in Safaricom Plc’s voice call performance indicators, including customer size, revenue, pricing, and usage patterns, highlighting overall market behaviour. Empirical results, through correlation and regression analyses, assess how composite and price-based marketing strategies influenced these indicators, directly addressing the study’s objective of determining their impact on the firm’s voice call segment performance.
3.1. Descriptive statistics
| Variable | Mean | Std. Dev. | Min | Max |
|---|---|---|---|---|
| Voice customer size in millions | 30.40467 | 10.50242 | 15.79 | 48.2 |
| Estimated annual expenditure on calls per customer(KES) | 693.7533 | 236.8362 | 189.41 | 996 |
| Voice revenue per year in billions | 81.912 | 8.57102 | 62.8 | 95.64 |
| Voice call cost per minute (KES) | 1.984 | .5872916 | 1.01 | 3 |
| Estimated annual number of voice minutes per customer | 1822.817 | 658.1856 | 236.75 | 2320 |
The descriptive analysis of the Safaricom call variables established that on average, the company has had about 30.4 million customers over the years. The average annual expenditure on calls for each customer was KES 695.75. The voice revenue segment earned the company an average of 81.912 billion per year. The average call per minute for Safaricom Plc calls was 1.984 shilling. Lastly, each customer spent an average of 1822.817 shillings on Safaricom calls per year.
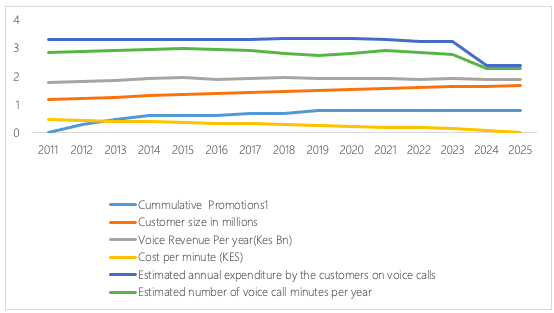
The observed data shows that Safaricom Plc’s voice market promotions were relatively stable over the years. Though, some growth was experienced in voice customer sizes, voice revenue per year, estimated annual expenditure on voice calls by customers and estimated number of voice minutes per customer over the years. Then again, over this period, the company witnessed a decline in the average cost of a direct voice call per minute.
| Cumulative promotions | Voice customer size | Annual voice revenue | Call cost per minute | Annual expenditure on direct voice calls | Number of voice minutes per year | |
|---|---|---|---|---|---|---|
| Cumulative promotions | 1 | |||||
| Voice customer size | 0.856058 | 1 | ||||
| Annual voice revenue | 0.743814 | 0.435027 | 1 | |||
| Call cost per minute | -0.7746 | -0.97297 | -0.30975 | 1 | ||
| Annual expenditure on direct voice calls | -0.28323 | -0.5611 | 0.075036 | 0.702453 | 1 | |
| Number of voice minutes per year | -0.32459 | -0.63112 | 0.074597 | 0.751276 | 0.94168 | 1 |
The correlation findings on Safaricom Plc’s voice segment reveals that progressive composite voice call promotions were strongly and positively correlated with annual voice revenue and annual voice revenue but negatively correlated with pricing (call costs per minute), expenditure on voice calls and number of voice minutes per year. Voice customer size was positively correlated with annual revenue and negatively correlated with call cost per minute, number of voice minutes and annual expenditure on direct voice calls.
Annual voice revenue was positively correlated with expenditure on direct voice calls, number of voice calls per annum but negatively correlated with call cost per minute. The call cost per minute was positively correlated with annual expenditure on calls and number of voice minutes per year but both correlations were significantly weak. Annual expenditure on direct voice calls was directly correlated with the number of voice minutes per year.
3.2. Empirical Findings
3Influence of Progressive composite marketing on voice call segment performance
| β | Std. Err. | P>t. | |
|---|---|---|---|
| Composite Promotions | 1 .6085859 | .1019148 | 0.000 |
| _Constant | 1.074526 | .0677124 | 0.000 |
The study established that direct call-linked composite promotion explained 73.28% of the change average in monthly data customer size [R2=0.7328]. The model was statistically significant F[1,13]= 35.66, p<0.05 ]. Progressive composite voice call promotion positively predicted direct call customer size [β=1.61, SE=0.101, p< .005].
| β | Std. Err. | t P>t | |
|---|---|---|---|
| Cumulative promotions | .1578205 | .0393329 | 0.001 |
| _cons | 1.811806 | .0261328 | 0.000 |
Call-linked composite promotion explained 55.33% of the change in annual revenue [R2=0.5533]. The model was statistically significant F [1,13] = 16.1, p<0.05]. Progressive composite direct voice call promotion positively predicted annual revenue [β=0.157, SE=0.101, p< .005].
| β | Std. Err. | P>t | |
|---|---|---|---|
| CummulativePromotions1 | -.4171154 | .3917315 | 0.306 |
| _cons | 3.452398 | .2602671 | 0.000 |
Call-linked promotion explained 8.02% of the change in annual expenditure on calls [R2=0.0802]. The model was not statistically significant F [1,13] = 1.130, p˃0.05]. Cumulative promotion negatively predicted annual expenditure on voice calls [β=-0.417, SE=0.391, p˃ .005].
| β | Std. Err. | t P>t | |
|---|---|---|---|
| Cumulative promotions | -.3195726 | .2582735 | 0.238 |
| _cons. | 3.002918 | . 1715974 | 0.000 |
Call-linked promotion explained 10.4% of the change in annual number of call minutes for each Safaricom Plc customer [R2=0.104]. The model was not statistically significant F [1,13] = 1.530, p˃0.05]. Cumulative promotion negatively predicted annual number of call minutes [β=-0.32, SE=0.26, p˃ .005].
| β | Std. Err. | P>t | |
|---|---|---|---|
| Call cost per minute in KES | 1.132766 | .0745636 | 0.000 |
| _cons | 1.772601 | .0229611 | 0.000 |
Call cost per minute explained 94.67% of the change in annual number of call customer size [R2=0.104]. The model was statistically significant F [1,13] = 230.80, p<0.05]. Call cost per minute positively predicted customer size [β=1.13, SE=0.074, p< .005].
| β | Std. Err. | P>t | |
|---|---|---|---|
| Cost per minute KES | .107628 | .0916318 | 0.261 |
| _cons | 1.940993 | .0282171 | 0.000 |
Call cost per minute explained 95.9% of the change in annual voice revenue [R2=0.959]. The model was not statistically significant F [1,13] = 1.38, p>0.05]. Call cost per minute promotion weakly and negatively predicted call revenue change [β=-0.11., SE=0.092, p> .005].
| Std. Err | P>t | ||
|---|---|---|---|
| Cost per minute KES | 1.694166 | .4760824 | 0.003 . |
| _cons | 2.718321 | .1466048 | 0.000 |
Call cost per minute explained 49.34% of the change in annual expenditure on voice call costs for customers [R2=0.4934]. The model was statistically significant F [1,13] = 12.66, p<0.05]. Call cost per minute promotion weakly but positively predicted annual expenditure on voice call change [β= 1.694., SE=0.476, p< .005].
| β. | Std. Err. | P>t | |
|---|---|---|---|
| Cost per minute KES | 0. 27294 | 0.08335 | 0.006 |
| _cons | 0.152402 | 0.011699 | 0.387 |
Call cost per minute explained 41.64% of the change in annual expenditure on voice call costs for customers [R2=0.4164]. The model was not statistically significant F [1,13] = 10.99, p>0.05]. Call cost per minute promotion weakly but positively predicted annual expenditure on voice call change [β= 27294., SE=0.08335, p> .005].
Discussion
The findings on Safaricom Plc’s voice call promotions and performance indicators depict a comprehensive picture of the relationship between Safaricom’s promotional strategies and direct voice segment business outcomes from 2011 onwards. The descriptive statistics indicate a stable and sizeable direct call customer base, with a modest growth in key indicators like customer size, annual voice revenue, and user expenditure. Interestingly, this miniscule growth occurred alongside a remarkable decline in the average cost per minute of voice calls, suggesting that leveraging competitive pricing strategies and promotions helped to retain more than attracting new ones over the study period.
The correlation analysis reveals strong and positive relationships between composite voice promotions and critical revenue outcomes. Precisely, progressive composite direct voice call promotions were positively associated with both voice customer size and annual revenue in this segment, confirming their roles in expanding Safaricom’s revenue generation. These findings correspond to economic theories like utility maximization and price elasticity, where lower prices and added incentives stimulate usage and increase overall demand among consumers (Raboy, 2017). Through promotions, the market leader’s voice brand’s value perceptions can improve, accelerating service uptake, even in markets with different maturities.
That said, the study found a negative correlation between promotions and metrics like voice segment pricing (call cost per minute), the customers’ annual call expenditure, and number of voice minutes used by each customer per year. Li, Li and Liu (2018) could refer to this as a form of cannibalization. This is because the results suggest that Safaricom’s price-based promotions successfully drove customer acquisition and revenue, alongside a reduction in per-minute revenues. This phenomenon can be attributed to other factors that may have shifted direct voice call usage behavior among Safaricom customers, like reducing reliance on direct voice call services in favor of data-based voice call communication.
The regression models generated deeper insights into the extent to which voice call promotions influence performance outcomes. As an illustration, a strong relationship was found between promotions and customer size, emphasizes that Safaricom Plc’s voice promotions served as effective tools driving direct voice subscriber growth. Similarly, promotions significantly predicted annual revenue, though the strength of the relationship was moderate. This reinforces the idea that while direct voice promotions attracted more users, the actual revenue impact may have depended on how those users utilized the service or combined voice with other offerings like app calls or app-based messaging services (Kim, Kim & Park, 2016). The non-significant influence of this promotion on annual expenditure on calls and the number of voice minutes per user suggest that although Safaricom managed to attract more voice users through composite promotions, voice customer spending behavior or consumption volume did not necessarily increase proportionately. In fact, the negative coefficients hint that customers may have benefitted from the cost reduction offers without necessarily increasing their total spending on the same. From Kumar, Li and Wang (2018), perspective, this outcome reflects a trade-off in aggressive price-based promotion, attracting more users at the expense of lower per-user revenue.
More importantly, the finding on aggressive pricing-based marketing as a predictor also offer valuable insights in Safaricom’s voice segment. While call cost per minute strongly predicted customer size positively (this implies that competitive pricing is a powerful driver of customer acquisition at Safaricom Plc’s voice segment) it showed a weak and statistically insignificant relationship with voice revenue, implying that beyond a certain point, reducing call prices does not necessarily translate to proportional increases in revenue, possibly due to saturation effects or substitution by data-based alternatives like VoIP. An empirical research conducted in Korea Republic established the same trend (Kim et al., 2016). A significant positive relationship between call cost and customer expenditure, albeit weak, indicates that price adjustments by a market leader in the telecommunication industry still influence overall consumer spending, though not as strongly as perceived.
Conclusion
This study ought to examine the influence of aggressive composite marketing through progressive composite promotions and competitive pricing on the performance of Safaricom Plc’s direct voice call segment. The findings shed light on the strategic value that voice call promotions have on call utilization, customer acquisition and revenue generation impacts, enabling oligopolistic telecom market leaders maintain a competitive edge in a shifting telecommunications landscape. The findings underscore effectiveness andlimits of overreliance on composite voice promotions and price-based marketing as a way of attracting customers and driving revenues. The study shows that these marketing strategies are crucial but not remarkably effective in boosting usage volume or per-user expenditure in emerging economies like Kenya. Telecom sector leaders like Safaricom must therefore strike a balance between composite promotional intensity and service diversification in this segment to maximize their revenues and achieve their growth targets. In particular, as telco direct voice services become commoditized, future promotional strategies may need to be more creative in terms of bundling, personalization, and customer experience rather than rely purely on price-driven incentives.
Limitation
This study relied exclusively on secondary data from publicly available sources such as company reports and regulatory databases, which may not capture internal marketing details or real-time market shifts. The focus on a single firm Safaricom Plc limits the generalizability of the findings to other telecom operators or regions. Additionally, the study period (2011–2025) may not fully reflect the influence of emerging technologies and post-2025 market disruptions such as 5G diffusion and VoIP substitution on voice call dynamics.
References
Rights and permissions

Disclaimer
All claims expressed in this article are solely those of the author and do not necessarily represent those of the publisher, editors, reviewers, or affiliated institutions. Any product, service, or claim that may be evaluated in this article is not guaranteed or endorsed by the publisher.
Publisher’s note
The publisher remains neutral with regard to jurisdictional claims.
Additional information
Peer review
Article Timeline
 Publication record
Cite this article
- Received
- August 25, 2025
- Revised
- September 23, 2025
- Accepted
- October 10, 2025
- Published
- October 20, 2025
- Version of record
- October 20, 2025
Share this article
Copy the canonical link to share this article with colleagues and readers.
Discover more research

Recent Publications

Most Read

Recommended
Save this article as a bookmark
Use your browser’s secure bookmark shortcut. Both desktop options are shown below.
Press Ctrl+D
In Chrome, Edge or Firefox, choose a folder if needed, then select Done.
Press ⌘ Command+D
In Safari, Chrome or Firefox, choose the bookmark location and confirm.
Cite this article
Copy a formatted citation or download a reference file.
Cited by
Crossref citation count for this DOI.