
Progressive Composite and Price-based marketing impact on Safaricom Internet Data segment performance


Abstract
This study examined the impact of Safaricom Plc’s promotion techniques on driving the company’s internet data dominance in Kenya. The study used secondary data from Safaricom Plc financial reports from 2014 through 2024. The study hypothesized that both price-based and non-price marketing initiatives drove internet consumption at 95% CI. A case study research design was adopted. A positive and strong association between the non-price and progressive composite marketing and the key performance indicators in the internet data segment. Bivariate regression analyses established that progressive composite data promotion predicted average monthly data usage by Safaricom customers [R2=0.9395: [β=0.54, SE=0.04, p< .005: F[1,10]= 155.35, p<0.05], internet data total revenue [R2=0.9395 : β=8.5, SE=0.65, p< .005: F[1,10]= 173.46, p<0.05], and average monthly active data subscription rate [R2=0.9421: β=3.43, SE=0.27, p< .005: F[1,10]= 162.59 p<0.05].At the same time, data pricing per MB as a promotional strategy explained the average monthly active data subscription rate [R2=0.9422 : β=0.748, SE=0.069, p< .005: F [1,10] = 118.47, p<0.05], the total revenue gained from internet data sales [R2=0.8241 : β=11.04, SE=1.61, p< .005: F [1,10] = 46.84 p<0.05], monthly active subscription rate [R2=0.9781: β=4.76, SE=3.88, p< .005; F [1,10] = 150.86, p<0.05].. These findings underscore the effectiveness of Safaricom Plc’s promotional and pricing strategies in enhancing market penetration and revenue growth in a saturated oligopolistic telecommunication industry where it is a leader.
Introduction
The current telecom industry firms are locked in fierce competition due to saturated markets, limited differentiation, converging technologies, and rapidly shifting consumer tastes (Onuoha, 2023). To stay ahead in the game of attracting new users, and holding onto existing ones, telecom firms roll out both price-based and non-price promotional tactics (Nuthu, 2015). The most popular among these include bold advertising, slashed prices, loyalty rewards, sponsorships, influencer collaborations, and data-driven digital campaigns (Mwaniki & Anene, 2023). Social media ads and influencer marketing facilitate personalized engagement and fostering communities that boost retention and advocacy, while data-driven strategies further optimize campaigns, ensuring efficient resource use and high returns (Rainy, 2025). These efforts tighten customer bonds and curb churn. Short-term promotions like time-limited data bundles, referral perks, and discounted voice plans spark quick action and sharpen market responsiveness (Chang & Castillo, n.d.). Together, these moves enhance customer value and create emotional ties that minimize chances of product switching.
Promotions are utilized perpetually to shape the business’s competitive positioning. This is achieved through enhanced consumer perceptions for the brand, driving demand, and setting brands apart in the market (Onuoha, 2023). In view of this, Viertamo (2023) suggests that firms using integrated marketing communications are better positioned to retain customers and gain a stronger brand equity, aligning with Keller’s Brand Equity Model, which ties consistent, targeted promotions to deeper loyalty and lower price sensitivity.
Kenya’s telecom sector is one of Africa’s most dynamic, powered by proliferating mobile use, fast-growing digital adoption, and the runaway success of mobile money services (Chesula & Kiriinya, 2018). As of October 2025, the sector contributed to 7–8% into Kenya’s GDP (Safaricom Plc, 2025). The market is oligopolistic, with Safaricom holding over 65% of mobile subscriptions. (Mwanzia, 2024). Nolan (2025) reports that mobile money use skyrocketed to 91% by mid-2025 (47.7 million active users), up from 77% in 2024, making telecoms financial powerhouses, indicating that this sector is remarkably vibrant. Worth USD 3.87 billion in 2025, the sector’s set to grow at a 2.24% CAGR, hitting USD 4.33 billion by 2030, fueled by booming data demand, fintech tie-ins, and rapid 4G/5G rollout (Safaricom Plc, 2025). Then again, amidst this success, challenges like market concentration, shifting regulations, and fading voice revenues as customer’s flock to digital platforms are real hurdles (Mwanzia, 2024).
Safaricom, the leader of Kenya’s telco sector boasts a robust ecosystem spanning telecom, cloud, and cybersecurity services (Safaricom Plc, 2025). It handles around 150 million M-Pesa transactions daily, processing half of Kenya’s GDP, which builds a strong competitive edge (Schachter, 2019). With Safaricom controlling over 65% of mobile subscriptions and Airtel Kenya at 30%, other players like Equitel, Zuku Jamii Telecom, and Telkom Kenya are forced to scramble for about 5% of the market (Mwanzia, 2024). The Communications Authority of Kenya (CA) proposed 2025 Fair Competition Regulations to curb Safaricom’s dominance, but weakened consultation requirements with the Competition Authority of Kenya (CAK) tend to favor big players (Competition Authority of Kenya, 2025). Airtel’s recent subscriber drop highlights its vulnerability to Kenya’s fierce pricing battles (Otieno & Mwale, 2025). The industry’s future hinges on balancing growth with fair competition to foster broader digital access.
Diverse promotional strategies are driving performance across telecom industry players and the wider private sector (Mwaniki & Anene, 2023). These tactics serve as key ingredients for navigating intense competition and ensuring sustainable growth among telecom players (Ngure, 2024). This study investigated how Safaricom’s continuous composite and aggressive pricing influenced the performance of its internet data segment, driving the company’s telco dominance over the past ten years (2014–2024).
Methods
2.1 Research Design
This study employs a structured framework to investigate the impact of aggressive marketing strategies on telecommunications performance, using a case study approach centered on Safaricom Plc. The research adopted a case study design, leveraging secondary data to examine how aggressive marketing strategies influence Safaricom’s product performance, specifically in data sales. The choice of this design was anchored on its ability to provide in-depth contextual analysis of marketing practices and their measurable impact on performance outcomes (Hollweck & Robert 2014). Quantitative data on internet data marketing and sales served as the primary metric for assessing performance, yielding evidence-based insights into the relationship between marketing aggressiveness and business success (Hollweck & Robert 2014). On the other hand, the choice of Safaricom’s position Plc was informed by its uniqueness as one of the global leader in the telecom industry in an emerging market. A detailed exploration of how its marketing strategies correlate with key performance indicators in the data sales segment informed this research.
2.2. Data Sources
The study relied on secondary data from credible, publicly available sources, including Safaricom’s annual reports, industry research reports, marketing campaign archives, and publications from the Communications Authority of Kenya (CA) and other regulatory bodies (Ajayi,2013) These sources were compiled into a comprehensive dataset encompassing both financial and non-financial performance indicators, including the marketing categories(price and composite-based) data sales revenue trends, pricing changes, subscriber growth patterns, and marketing expenditures.Where data gaps emerged, supplementary reports from reputable market research organizations and peer-reviewed journal articles on telecom marketing and competitiveness were utilized to fill it. In cases of significant data absence, simulation techniques were applied to estimate missing values.
2.3. Data Collection Procedure
Data were systematically gathered from Safaricom’s official website, stock exchange filings, and public databases like CAK reports, GSMA, and Statista. Archived media and online sources were also searched to collect information on data-related marketing activities, including campaign launches, promotional offers, and sponsorships. All data were organized chronologically (2014–2024) to enable trend and correlation analyses. To ensure accuracy and consistency, data were cross-verified across multiple sources whenever possible. Standardized measurement units and time periods were used to maintain comparability across datasets.
2.4. Data Analysis
The collected quantitative data were cleaned, processed, and analyzed using both descriptive and inferential statistical methods. Descriptive statistics, including means, standard deviations, minimums, and maximums, were calculated to summarize key trends. A line graph was generated to visualize variable movements in response to Safaricom Plc’s major aggressive composite and price-based marketing initiatives aimed at driving data purchases among current and prospective customers. Composite marketing evaluation encapsulated assessing how offerings like bundled data offerings and anniversary offers influenced internet segment performance while price-based marketing assessment considered internet price reduction as an isolated technique of driving internet consumption. Inferential techniques, including correlation and bivariate regression analyses, were employed to assess relationships between variables over time and to evaluate the impact of aggressive data marketing on key performance indicators, such as annual revenue changes and data consumption rates. A preliminary test revealed a violation of the normality assumption, which was addressed through log transformation to ensure robust statistical analysis. These methods paved the way for a clear understanding of the relationship between internet marketing aggressiveness and the company’s performance outcomes in this segment.
Findings
The findings present descriptive results that outline key patterns in Safaricom’s internet data segment performance, focusing on customer growth, revenue trends, pricing dynamics, and expenditure behaviour. These descriptive insights establish the general market behaviour over time. Empirical results, derived from correlation and regression analyses, are then used to test how composite and price-based marketing strategies influenced these performance indicators directly addressing the study’s objective of assessing their effectiveness in sustaining competitiveness within Kenya’s oligopolistic telecom market.
3.1. Descriptive statistics
| Variable | Mean | Std. Dev. | Min | Max |
|---|---|---|---|---|
| Internet data usage per month in gigabytes | 2.608333 | 1.409357 | .6 | 8.3 |
| Average price per megabyte (KES) | 2.010417 | 1.809491 | .275 | 5.5 |
| Average monthly active subscribers in millions | 23.51167 | 8.903016 | 9.56 | 35.3 |
| Total revenue from internet data sales in billions(KES) | 47.19417 | 22.00664 | 14.8 | 78.5 |
On average, Safaricom customers consumed 2 gigabytes of data per month, with usage ranging from a minimum of 0.6 GB to a maximum of 8.3 GB. The average price per megabyte was KES 2, varying between KES 0.25 and KES 5.5. The company maintained an average of 23 million monthly internet subscribers, with subscriber numbers fluctuating between 9.56 million and 35.3 million. Annual revenue from internet data sales averaged KES 47.19417 billion, with a minimum of KES 14.8 billion and a maximum of KES 78.5 billion.
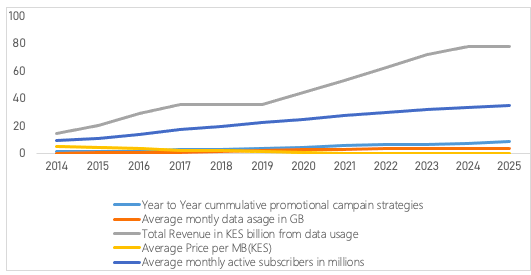
Since 2014, Safaricom Plc has consistently implemented data promotion strategies, leading to a steady rise in average monthly active internet subscribers. Similarly, both average monthly data usage and total revenue from internet data sales have shown an upward trend. However, the average price per megabyte charged by the company has experienced a decline throughout the study period.
| Year to Year progressive composite promotional campaign strategies | Average monthly data usage in GB | Total Revenue in KES billion from data usage | Average Price per MB(KES) | Average monthly active subscribers in millions | |
|---|---|---|---|---|---|
| Year to Year progressive composite promotional campaign strategies | 1 | ||||
| Average monthly data usage in GB | 0.969289015 | 1 | |||
| Total Revenue in KES billion from data usage | 0.972364814 | 0.958517 | 1 | ||
| Average Price per MB(KES) | -0.895941324 | -0.96029 | -0.90778 | 1 | |
| Average monthly active subscribers in millions | 0.970597989 | 0.992001 | 0.974955 | -0.96842 | 1 |
Composite promotional strategies exhibited strong correlations with average internet data usage, total revenue from the data segment, average monthly subscribers, and average price per megabyte. Total revenue from internet data sales showed a strong positive correlation with average monthly data usage and subscriber numbers, but a negative correlation with the average price per megabyte. Similarly, total data sales revenue was inversely related to price while positively associated with subscriber numbers. Additionally, the study identified a strong positive relationship between the average price per megabyte and average monthly active internet subscribers.
3.2. Empirical Findings
| Average monthly data usage in GB | β. | Std. Err. | t P>t |
|---|---|---|---|
| Progressive composite promotion | .542823 | .0435518 | 0.000 |
| _Constant | -.015311 | .2352068 | - 0.949 |
Progressive composite data promotion strategies over the years explained 93.95% of the change average in monthly data consumption [R2=0.9395].This promotion positively predicted average monthly data use by customers [β=0.54, SE=0.04, p< .005] and this model was statistically significant F[1,10]= 155.35, p<0.05].
| Total Revenue in KES billions from data sales | Β | Std. Err. | t P>t |
|---|---|---|---|
| Progressive composite data promotion | 8.502895 | .6455983 | 0.000 |
| _Constant | 6.096842 | 3.486629 | 0.111 |
Progressive composite internet data promotion also explained 94.55% of the change in total revenue from data sales [R2=0.9395]. The variable positively predicted average monthly data use by customers [β=8.5, SE=0.65, p< .005]and the model was statistically significant F[1,10]= 173.46, p<0.05].
| Average monthly active subscription rate | β | Std. Err. | t P>t |
|---|---|---|---|
| Progressive composite promotion | 3.433684 | .2692827 | 0.000 |
| _Constant | 6.915526 | 1.454293 | 0.001 |
Progressive composite internet data promotion explained 94.21% of the change in average monthly active data subscription rate [R2=0.9421]. The promotion positively predicted average monthly data use by customers strongly [β=3.43, SE=0.27, p< .005] and the model was statistically significant F[1,10]= 162.59 p<0.05 ].
| Average monthly data subscription. | β | Std. Err. | P>t |
|---|---|---|---|
| Average Price per MB | 7479433 | .0687158 | 0.000 |
| _cons | 4.112011 | .1823648 | 0.000 |
Safaricom’s data charges per MB as a promotional strategy explained 92.22% of the change in average monthly active data subscription rate [R2=0.9422]. Average data pricing positively but weakly predicted average monthly data use by customers [β=0.748, SE=0.069, p< .005] and the model was statistically significant F [1,10] = 118.47, p<0.05].
| Total Revenue from data sales. | β | Std. Err. | P>t |
|---|---|---|---|
| Average Price per MB | 11.04022 | 1.61315 | 0.000 |
| _cons | 69.38962 | 4.281136 | 0.000 |
Data pricing as a marketing strategy by Safaricom Plc explained 82.41% of the change in total revenue gained from internet data sales [R2=0.8241]. Internet data pricing positively and strongly predicted total revenue [β=11.04, SE=1.61, p< .005]and the model was statistically significant F [1,10] = 46.84 p<0.05].
| Average monthly active data subscription | β | Std. Err. | P>t |
|---|---|---|---|
| Average Price per MB | 4.764786 | .3879382 | 0.000 |
| _cons | 33.09087 | 1.029549 | 0.000 |
Internet data pricing as promotional strategy explained 93.78% of the change in monthly active subscribers for Safaricom Plc [R2=0.9781]. The data charges positively and strongly predicted average monthly subscription rates [β=4.76, SE=3.88, p< .005] and thismodel was statistically significant F [1,10] = 150.86, p<0.05].
Discussion
Safaricom’s strategic initiatives have significantly shaped its dominance in the Kenyan telecommunications market over these study period. This evident from the current research findings which shed light on the dynamics of the company’s internet data market performance, focusing on the interplay between composite data promotion strategies, pricing, subscriber numbers, data consumption, and revenue generation. This discussion synthesizes the findings, highlighting their implications, and draws conclusions on their significance for Safaricom’s business strategy and the broader telecommunications industry.
The study indicates that, on average, Safaricom customers consume 2 gigabytes of data monthly, with a range from 0.6 GB to 8.3 GB. This variability suggests diverse customer needs, from light to heavy data users, reflecting the growing reliance on internet services for both personal and professional purposes. The average price per megabyte of KES 2, ranging from KES 0.25 to KES 5.5, indicates a flexible pricing strategy that caters to different customer segments. The decline in the average price per megabyte over the study period aligns with global trends of falling data costs, driven by competition and economies of scale (Coyle & Li, 2021). This pricing strategy could have likely contributed to the increase in average monthly active Safaricom Plc internet subscribers, which stood at 23 million, with a range of 9.56 to 35.3 million. The strong positive correlation between pricing and subscriber numbers (R² = 0.9781) underscores the effectiveness of competitive pricing as a tool to expand and create a firmer grip of the telecommunication industry market share as a leader.
The analysis portrays Safaricom’s progressive composite internet data promotion strategy as a cornerstone of its success. The regression analysis demonstrates that these strategies account for 93.95% of the variation in monthly data consumption (R² = 0.9395), 94.55% of the change in total revenue (R² = 0.9455), and 94.21% of the change in subscriber numbers (R² = 0.9421). These high R² values indicate that composite promotional activities, like bundled data packages, loyalty programs, and marketing campaigns, were highly effective in driving customer engagement and revenue. The strong and statistically significant positive coefficients (β = 0.54 for data consumption, β = 8.5 for revenue, and β = 3.43 for subscribers) further confirm that composite promotions served as robust influencers of internet segment performance. These findings suggest that Safaricom’s focus on innovative promotional strategies has successfully stimulated internet data demand to sustain its market leadership. The effectiveness of promotions like bundled packages and loyalty programs in driving demand can be established, consistent with Consumer Behavior Theory, which suggests that incentives shape purchasing decisions (Subramanian,2017). The positive association between pricing and subscriber numbers further highlights the role of affordability in driving subscription rates. By maintaining competitive pricing, Safaricom Plc has made internet access more accessible, particularly for price-sensitive consumers in Kenya. This strategy has not only expanded its customer base but also fostered greater digital inclusion, aligning with broader socio-economic goals of enhancing connectivity.
The link between pricing and revenue presents a nuanced picture. While total revenue from data sales, averaging KES 47.19417 billion annually is negatively correlated with price per megabyte. This negative relationship highlights a trade -off: lower prices stimulate higher consumption and attract more subscribers, but they may reduce revenue per unit of data. However, the overall revenue growth suggests that the increase in subscriber base and data usage more than offsets the impact of lower prices. This balance reflects Safaricom’s strategic pricing approach, which prioritizes a firm market grip and volume over high margins per megabyte. Market Penetration Pricing Theory further explains Safaricom’s strategy of reducing prices to capture a larger market share, as evidenced by the strong positive association between pricing and subscriber numbers (Erbil, 2022).
Conclusion
Safaricom Plc’s success in the internet data market from 2014 through 2024 stemmed from its strategic blend of aggressive data promotion and flexible pricing. Both composite and price-specific promotional strategies significantly drove data consumption, subscriber growth, and revenue significantly, while competitive pricing made internet services more accessible, boosting market penetration and telco internet offering grip amidst intense rivalry. The negative link between price per megabyte and revenue underscores the importance of balancing affordability with profitability. For Safaricom, continuing to innovate in promotional strategies while maintaining competitive pricing will be critical to sustaining its market leadership. These insights also underscore the power of customer-centric strategies in driving growth and market grip in competitive markets. By prioritizing affordability and persistent customer engagement through various bundled packages, Safaricom has not only achieved commercial success but also led in advancing digital connectivity in Kenya.
Limitation
The study relied entirely on secondary data from publicly available sources, which may limit the accuracy and completeness of some variables due to reporting inconsistencies. Additionally, the focus on a single firm Safaricom Plc restricts the generalizability of the findings to other telecom operators or markets. The ten-year data range (2014–2024) may also not fully capture recent post-2024 market dynamics or emerging technologies influencing consumer behaviour.
References
Rights and permissions

Disclaimer
All claims expressed in this article are solely those of the author and do not necessarily represent those of the publisher, editors, reviewers, or affiliated institutions. Any product, service, or claim that may be evaluated in this article is not guaranteed or endorsed by the publisher.
Publisher’s note
The publisher remains neutral with regard to jurisdictional claims.
Additional information
Data availability
All data supporting the findings of this study are included in the article and its supplementary materials.
Funding
This research received no specific grant from any funding agency in the public, commercial, or not-for-profit sectors.
Ethics declarations
Ethics approval was not required for this study.
Peer review
This article was peer reviewed.
Article Timeline
 Publication record
Cite this article
- Received
- August 22, 2025
- Revised
- September 20, 2025
- Accepted
- October 12, 2025
- Published
- October 20, 2025
- Version of record
- October 20, 2025
Share this article
Copy the canonical link to share this article with colleagues and readers.
Discover more research

Recent Publications

Most Read
- Composite and Price-based Marketing for Oligopolistic Telco Market Leaders-A study on Safaricom Plc Direct Voice Call Segment
- Institutional Environment and Investor Confidence in the East and Horn of Africa
- Progressive Composite and Price-based marketing impact on Airtel Kenya Internet Data segment performance

Recommended
- Progressive Composite and Price-based marketing impact on Airtel Kenya Internet Data segment performance
- Composite and Price-based Marketing for Oligopolistic Telco Market Leaders-A study on Safaricom Plc Direct Voice Call Segment
- Regulatory and Political Risk, and Multinational Corporate Strategy in Kenya
Save this article as a bookmark
Use your browser’s secure bookmark shortcut. Both desktop options are shown below.
Press Ctrl+D
In Chrome, Edge or Firefox, choose a folder if needed, then select Done.
Press ⌘ Command+D
In Safari, Chrome or Firefox, choose the bookmark location and confirm.
Cite this article
Copy a formatted citation or download a reference file.
Cited by
Crossref citation count for this DOI.