
Progressive Composite and Price-based marketing impact on Airtel Kenya Internet Data segment performance


Abstract
This study examined the performance of a follower firm in an oligopolistic telecommunications market over a ten-year period (2014-2024). The study hypothesized that price-based and composite marketing strategies influenced the company’s data segment performance at 95% confidence interval. A case study research design cantered on Airtel Kenya Limited Plc was adopted. Secondary data on internet data services, subscriber trends, pricing strategies, and promotional efforts was collected for analysis. The findings revealed a strong positive relationship between progressive composite promotion, subscriber numbers, data usage, and data revenue, but a negative correlation with internet data pricing. Regression analyses further demonstrated that progressive composite promotional efforts explained monthly data subscription rates (R² = 0.8548, β = 1.34, SE = 0.175, p < .005), change in annual data revenue (R² = 0.8113, β = 1.34, SE = 3.31, p < .005), and monthly data usage (R² = 0.7885, β = 0.693, SE = 0.113, p < .005). On the other hand, average price per megabyte predicted regular internet subscriber numbers (R² = 0.4431, β = 3.11, SE = 1.10, p < .005), change in data revenue (R² = 0.7224, β = 0.61, SE = 0.1191, p < .005), and monthly data usage (R² = 0.6906, β = 0.897, SE = 0.1191, p < .005). These findings suggest that Airtel’s promotional strategies and outcomes align with penetration pricing and consumer behavior theories and generate valuable insights for Telecom providers navigating competitive landscapes in oligopolistic markets in which they occupy the position of followers.
Introduction
Telecom companies today strategically tailor their internet data offerings and promotions to align with evolving market dynamics, shaping their marketing strategies and driving desired outcomes (Mathenge, 2017). Most of these promotions hinge on AIDA model (Attention, Interest, Desire, Action), which posits that aggressive promotions capture consumer attention and drive subscription and usage (Wong, Ong & Leow, 2024). Drawing on the Resource-Based View (RBV), telecoms leverage internal strengths, like robust network infrastructure, advanced customer data analytics, and strong brand equity to sustain a competitive edge. Meanwhile, Utility Maximization Theory highlights that consumers seek to maximize value from their purchases (Oliveira-Castro et al., 2015). To capitalize on this, telecoms deploy promotions like bonus data, time-limited free access, or social media-specific bundles to differentiate themselves from competitors, boost revenue, and enhance customer appeal and loyalty (Cochran, Stegman & Foos, 2021). These efforts are most effective when promotions align closely with the preferences of both potential and existing users. Similarly, Price Discrimination Theory illustrates how telecoms maximize profits by implementing tiered pricing and segmented data bundles tailored to diverse consumer segments (Zakaria, Lim & Aamir, 2024).
Most telecom companies align their promotional strategies with theoretical frameworks, supported by empirical evidence (Chumba, 2019). Research demonstrates that targeted promotions significantly increase average data usage per user, confirming that well-designed offers enhance customer satisfaction and engagement (Mwanzia, 2024). Studies, such as Oziri et al. (2022), show that effective promotional campaigns positively impact key metrics like Average Revenue Per User (ARPU), churn rate, and customer acquisition. Similarly, scholars like Paetsch et al. (2017) and Ongache (2015) highlight that temporary price reductions or bonus data deals drive substantial uptake, reflecting the price elasticity of demand for mobile data services. In highly competitive markets like Kenya, India, and Nigeria, telecoms engage in aggressive pricing and promotional battles, resulting in significant shifts in market share (Gitonga, Kariuki & Kimani, 2025). Moreover, the rising internet penetration in rural and underserved areas of emerging markets underscores the link between promotions and broader objectives, such as digital inclusion (Ongache, 2015). Ultimately, as Mathenge (2017) notes, the connection between theory and practice is evident: telecom promotions strategically integrate economic principles, customer behaviour, and business goals to capture value, boost usage, and maintain competitiveness in rapidly evolving digital markets.
According to Ngure (2024), Airtel Kenya has secured a dynamic and increasingly competitive position in Kenya’s telecom market. As of July 2025, Airtel commanded over 24 million active SIM subscribers, capturing a 32.2% share of the mobile subscription market—a significant advance that narrowed the gap with market leader Safaricom Plc. Airtel’s mobile broadband presence is equally robust, holding a 32.6% market share, solidifying its position as a strong second to Safaricom. To bolster its standing, Airtel has aggressively expanded its geographic coverage by rolling out new network sites and enhancing indoor service in key urban and commercial hubs, mirroring strategies employed by its competitors. Renowned for its low-cost bundled voice and data plans, Airtel is widely perceived as an affordable alternative for Kenyan consumers. Nevertheless, Safaricom Plc maintains a dominant lead in both the telecom and mobile money markets. The interplay of theoretical and empirical marketing insights highlights the potency of data promotions as a competitive tool. This study explores the impact of price-based and composite promotion strategies on Airtel’s internet segment performance over the past decade (2014–2025).
Methods
2.1 Research Design
This study employed a structured framework to investigate the impact of progressive marketing strategies on internet data segment performance for market followers in monopolistic telecommunication industry. The choice of Airtel limited was informed by its aggressive market followership in the Kenya telecommunications market. With about 24 million subscribers as of 2025 against safaricom’s 49 million,Airtel Kenya ranks second and commands a significant proportion of Kenya’s telecommunication market share, just behind one of the world’s most successful telecommunication firms.
The research adopted a case study design, leveraging secondary data to examine how aggressive marketing strategies influence Airtel Kenya Limited’s internet segment performance (Ridder, 2017). This design was selected for its ability to provide in-depth contextual analysis of marketing practices and their measurable impact on performance outcomes (Hancock, Algozzine & Lim, 2021). Quantitative information on internet data sales served as the primary metric for assessing performance, yielding evidence-based insights into the relationship between marketing trends and business success. The case study approach was particularly suitable given Airtel Kenya Limited’s position as an immediate telco market follower behind Safaricom Plc, which is one of the popular global leaders in the telecom industry, enabling a detailed exploration of how its marketing strategies correlate with key performance indicators in the data sales segment.
2.2. Data Sources
The study relies on secondary data from credible, publicly available sources, including Airtel Kenya Limited’s annual reports, industry research reports, marketing campaign archives, and publications from the Communications Authority of Kenya (CA) and other regulatory bodies (Ajayi, 2017). These sources were compiled into a comprehensive dataset encompassing both financial and non-financial performance indicators, including internet data sales, revenue trends, pricing changes, subscriber growth patterns, and marketing expenditures. Where data gaps existed, supplementary reports from reputable market research organizations and peer-reviewed journal articles on Kenya’s telecom marketing and competitiveness were utilized. In cases of significant data absence, simulation techniques were applied to estimate missing values (McIsaac & Cook, 2017).
2.3. Data Collection Procedure
Data were systematically gathered from Airtel Kenya Limited’s official website, stock exchange filings, and public databases like CA reports, GSMA, and Statista. Archived media and online sources were also searched to collect information on data-related marketing activities, including campaign launches, promotional offers, and sponsorships (Ajayi, 2017). All data were organized chronologically (2014–2025) to enable trend and correlation analyses. To ensure accuracy and consistency, data were cross-verified across multiple sources whenever possible. Standardized measurement units and time periods were used to maintain comparability across datasets.
2.4. Data Analysis
The collected quantitative data were cleaned, processed, and analyzed using both descriptive and inferential statistical methods. Descriptive statistics, including means, standard deviations, minimums, and maximums, were calculated to summarize key trends. A line graph was generated to visualize variable movements in response to Airtel Kenya Limited Plc’s major aggressive marketing initiatives aimed at driving data purchases among current and prospective customers. Inferential techniques, including correlation and bivariate regression analyses, were employed to assess relationships between variables over time and to evaluate the impact of aggressive data marketing on key performance indicators, such as annual revenue changes and data consumption rates (Stpor, 2020). A preliminary test revealed a violation of the normality assumption, which was addressed through log transformation to ensure robust statistical analysis (Cleophas & Zwinderman, 2016). Using these techniques, data was collected and analyzed, paving the way for a clear understanding of the relationship between internet marketing aggressiveness and the company’s performance outcomes in this segment.
Findings
The findings present descriptive statistics that summarize Airtel Kenya Limited’s internet data segment performance over the 2014–2024 period, highlighting trends in data subscription, usage, revenue, and pricing behaviour. These descriptive results establish the general patterns that characterize Airtel’s market response as a telecom sector follower. Empirical results, obtained through correlation and regression analyses, then examine how progressive composite and price-based marketing campaigns influenced these performance indicators, directly addressing the study’s objective of determining the effect of aggressive marketing on Airtel Kenya’s data segment growth and competitiveness within an oligopolistic market structure.
3.1. Descriptive statistics
| Variable | Mean | Std. Dev. | Min | Max |
|---|---|---|---|---|
| Number of Airtel Kenya data subscribers in millions | 5.925 | 3.241808 | 2.1 | 12 |
| Revenue from data consumption in billions | 10.48333 | 8.191551 | 2.1 | 27.4 |
| Average price per MB of data in KES | .49875 | .6934962 | .065 | 2 |
| Average data usage per month in GB | 1.808333 | 1.739754 | .15 | 16 |
On average, Airtel Kenya had 5.5 million subscribers over the study period, with a maximum of 12 million and minimum of 2.1 million. Company earned an average of 10.5 billion Kenya shillings over this period, with a minimum of KES 2.1 billion and a maximum of 27.4 billion shillings. The average cost per megabyte was 0.5 shillings, with a maximum of 2 shillings and a minimum of 0.065 shillings. The average data usage was 1.808333 gigabytes per month, with a maximum of 16 GB and a minimum of 0.15 GB.
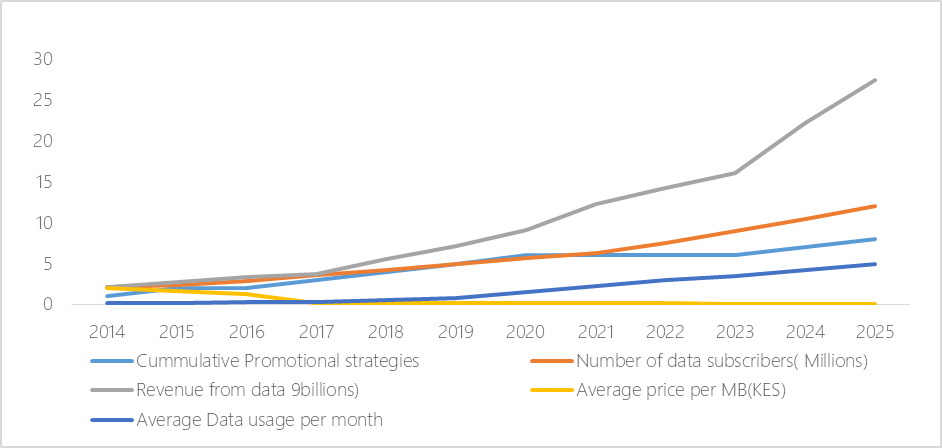
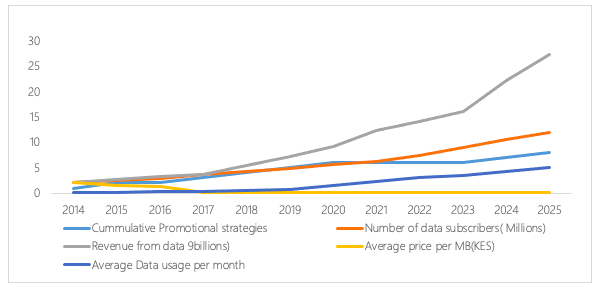
The study established that there has been a progressive increase in the promotional strategies that Airtel has been using over the ten years of assessment. Revenue from data sales exhibited the highest rate of increase in the last ten years. Other variables like average data usage per month, and number of data subscribers also increased but at a lower rate. That said, over this period, the price that Airtel Kenya charged per MB of internet data declined.
| Cumulative data promotion strategies | Number of data subscribers in millions | Revenue from Data in KES billions | Average price per MB of data | Average monthly Data usage | |
|---|---|---|---|---|---|
| progressive data promotion strategies | 1 | ||||
| Number of data subscribers in millions | 0.924575603 | 1 | |||
| Revenue from internet data in KES billions | 0.900730319 | 0.990911656 | 1 | ||
| Average price per MB of data | -0.827943977 | -0.66567443 | -0.594077463 | 1 | |
| Average monthly internet data usage | 0.887979243 | 0.986268179 | 0.988374752 | 0.57385 | 1 |
The correlation analysis revealed a strong positive relationship between data promotion strategies and key metrics, including the number of internet subscribers per month, revenue from data sales, and average monthly data usage. However, these strategies were negatively correlated with the average price per megabyte of data. Similarly, average monthly internet data usage showed a positive correlation with both the number of subscribers and average data usage but a negative correlation with the average price per megabyte. Revenue from monthly data usage was strongly positively correlated with average monthly data usage, yet it exhibited a negative correlation with the average price per megabyte. Additionally, the study identified a moderate positive correlation between the average price per megabyte and average monthly internet data usage.
3.2. Empirical Findings
3.2.1. Influence of Progressive Composite Data Promotion on Airtel Segment Performance
| β | Std. Err. P>t. | |
|---|---|---|
| Composite Promotional strategies | 1.344512 | .1752047 0.000 . |
| _cons | -.3493902 | .8990806 0.706 |
Progressive composite internet data promotion explained 85.48% of the change average in monthly data subscription rate among Airtel Kenya subscribers[R2=0.8548]. Also, the cumulative promotion positively predicted average monthly data use by customers [β=1.34 SE=0.175, p< .005]and thismodel was statistically significant F[1,10]= 58.89, p<0.05 ].
| β | Std. Err. | P>t | |
|---|---|---|---|
| Composite Promotion | 3.309756 | .5047424 | 0.000 |
| _cons | -4.962195 | 2.590137 | -0.084 |
The study found that Airtel Kenya’s progressive composite internet data promotion explained 81.13% of the change in annual revenue from data [R2=0.8113]. The progressive promotion strongly and positively predicted change in annual revenue from data [β=1.34 SE=3.31, p< .005]and themodel was statistically significant F[1,10]= 43.00, p<0.05].
| β | Std. Err. | P>t | |
|---|---|---|---|
| Composite Promotion | .6929878 | .1134934 | 0.000 |
| _ cons - | 1.42561 | .5824029 | 0.034 |
Progressive composite internet data promotion by Airtel Kenya explained 78.85% of the change in the average monthly usage of data by Airtel customer base [R2=0.7885]. Cumulative promotion weakly but positively predicted change in average monthly data use [β=0.693 SE=0.113, p< .005]and the model was statistically significant F[1,10]= 37.28, p<0.05 ].
3.2.2. Influence of Price-based Promotion on Airtel Segment Performance
| β | Std. Err. | P>t | |
|---|---|---|---|
| Average price per MB KES | 3.111753 | 1.103121 | 0.018 |
| _cons | 7.476987 | .9160622 | 0.000 |
When isolated from the composite promotion, average price per MB alone explained 44.31% of the change in the number of data subscribers per month [R2=0.4431]. The price charged per megabyte positively predicted change in the number of data subscribers per month [β=3.11 SE=1.10, p< .005]and the model was statistically significant F[1,10]=7.96, p<0.05 ].
| β | Std. Err. | P>t | |
|---|---|---|---|
| Average price per MB in KES | .6077713 | .1191457 | 0.000 |
| _cons | .4986908 | .0963128 | 0.000 |
The average price that Airtel Kenya charged per MB explained 72.24 % of the change data revenue that the company earned annually [R2=0.7224]. Data pricing positively predicted change in annual revenue from data [β=0.61 SE=0.1191, p< .005] andthe model was statistically significant F [1,10] =26.02, p<0.05].
| β | Std. Err. | P>t | |
|---|---|---|---|
| Average price per MB in KES | .8971298 | .189878 | 0.001 |
| _cons | .5851904 | .1534901 | 0.003 |
Airtel Kenya’s average price per MB explained 69.06 % of the change in Airtel data use per month [R2=0.6906. Data pricing positively predicted change in the monthly data use [β=0.897 SE=0.1191, p< .005] andthe model was statistically significant F [1,10] =22.32, p<0.05].
Discussion
The analysis of Airtel Kenya's internet data segment performance over a ten-year period casts a comprehensive image of data segment for an oligopolistic telecommunication sector follower market performance at maturity stage. Critical insights can be drawn from the data service performance, including subscriber trends, pricing strategies, and promotional efforts. It can be established that with the application of diverse promotional efforts, the company witnessed insightful dynamics in terms of internet data usage, and revenue generation, which can be linked to various consumer behavior, price elasticity, and market penetration economic and marketing theories and concepts.
The study highlights a positive association between progressive composite promotional strategies, internet subscriber numbers, data usage, and revenue from data sales. This suggests that Airtel’s composite promotions successfully stimulated internet data demand. The company's data revenue grew significantly amidst these promotions, a phenomenon that can be linked to expanding average Airtel internet data usage per month in Kenya. These dynamics illuminate success in Airtel’s internet data marketing strategies and rise in consumer reliance on mobile data. Regression analyses further quantify the impact of these strategies. Progressive composite internet data promotion accounted for a significant portion of the variation in monthly Airtel data subscription rates. Similarly, promotional efforts explained a remarkable change in annual data revenue and average monthly data usage. These findings align with marketing theories, like the AIDA model, positing that aggressive promotions capture consumer attention and drive subscription and usage (Wong et al., 2024). The marketing approach that made internet data affordable succeeded to attract more customers in this segment, expanding the company’s customer base.
Interestingly, the average price per megabyte also played a significant role in driving internet data sales, revenue, usage and customer base for Airtel Kenya limited in the last decade. This suggests that pricing played a noteworthy contribution to a variation in subscriber numbers, annual data revenue, and monthly data usage, all with statistically significant positive effects. More importantly, it can be deduced that in Kenya’s maturing telecommunication markets, customers are highly price-sensitive to internet data prices. Similar results were established in the Vietnam market by Duc and Duc (2017). The positive correlation between price per megabyte and data usage, despite the negative correlation with subscriber numbers and revenue, suggests a complex interplay. Lower prices likely attracted more subscribers, but the moderate positive correlation with usage indicates that pricing strategies were carefully balanced to maintain revenue growth, supporting the theory of penetration pricing, where low initial prices expand market share before stabilizing at profitable levels (Ernbil, 2022). Through these efforts, Airtel Kenya was able to maintain a substantial subscriber base, with notable fluctuations over the period as a follower in the highly saturated telecommunications market.
Conclusion
The findings on the internet data segment for Airtel Kenya limited over the least ten years (2014-2024) underscore the effectiveness of company’s strategic focus on data promotion and competitive pricing to drive market growth. The strong positive impact of composite promotional strategies on subscriber numbers, data usage, and revenue aligns with consumer behavior theories, emphasizing the role of marketing in shaping demand. The negative association between data prices and subscriber/revenue growth reflects price elasticity in a highly competitive telecom market, where affordability enhances product appeal, capturing market share. However, the moderate positive correlation between price and usage suggests that Airtel maintained a pricing strategy that balanced affordability with profitability. These results validate the relevance of penetration pricing and promotional strategies to achieve market expansion by a market follower in an oligopolistic telecommunications market, as predicted by economic and marketing theories. Consequently, these findings on Airtel Kenya’s success highlight the importance of adaptive strategies among the key players who are in a follower position in maturing telecommunications markets, as a crucial component of navigating these business landscapes.
Limitation
The study depended primarily on secondary data from publicly available financial and regulatory sources, which may limit the precision of certain variables such as promotional expenditure or campaign effectiveness. The analysis focused solely on Airtel Kenya Limited, which restricts generalization across other telecom operators. Additionally, the study period (2014–2024) may not fully capture the post-2024 competitive effects of digital service bundling, technological upgrades, and data pricing innovations in Kenya’s telecom sector.
References
Rights and permissions

Disclaimer
All claims expressed in this article are solely those of the author and do not necessarily represent those of the publisher, editors, reviewers, or affiliated institutions. Any product, service, or claim that may be evaluated in this article is not guaranteed or endorsed by the publisher.
Publisher’s note
The publisher remains neutral with regard to jurisdictional claims.
Additional information
Data availability
All data supporting the findings of this study are included in the article and its supplementary materials.
Ethics declarations
Ethics approval was not required for this study.
Article Timeline
 Publication record
Cite this article
- Received
- August 21, 2025
- Revised
- September 18, 2025
- Accepted
- October 11, 2025
- Published
- October 20, 2025
- Version of record
- October 20, 2025
Share this article
Copy the canonical link to share this article with colleagues and readers.
Discover more research

Recent Publications

Most Read

Recommended
- Progressive Composite and Price-based marketing impact on Safaricom Internet Data segment performance
- Composite and Price-based Marketing for Oligopolistic Telco Market Leaders-A study on Safaricom Plc Direct Voice Call Segment
- Regulatory and Political Risk, and Multinational Corporate Strategy in Kenya
Save this article as a bookmark
Use your browser’s secure bookmark shortcut. Both desktop options are shown below.
Press Ctrl+D
In Chrome, Edge or Firefox, choose a folder if needed, then select Done.
Press ⌘ Command+D
In Safari, Chrome or Firefox, choose the bookmark location and confirm.
Cite this article
Copy a formatted citation or download a reference file.
Cited by
Crossref citation count for this DOI.