

Abstract
This study examines the prevalence and structural production dynamics of illicit alcohol outlets in Nairobi’s informal settlements, with a focus on Embakasi East. Using an outlet-level survey and structured observational checklist, data were collected on 393 alcohol-selling premises, of which 118 (30%) processed illicit alcohol. These were categorised into homemade brews, counterfeit packaged alcohol, and decontaminated industrial ethanol products. A two-tier analysis determined that the majority of illicit outlets engaged in self-production, while a smaller proportion relied on external supply chains. The findings reveal a dual-embeddedness structure, where illicit outlets function as both producers and distributors within a parallel market economy. This challenges assumptions that illicit supply is primarily external and underscores the embedded social and economic role of small-scale production.
Introduction
Background
Illicit alcohol remains a pervasive public health and socio-economic concern across low- and middle-income countries, with urban informal settlements often exhibiting disproportionately high levels of unregulated production and sale (Bodewes, 2010; World Health Organization [WHO], 2018; Campbell et al., 2009). Besides, global evidence shows density increases consumption, binge drinking, dependence, and chronic disease, prompting the WHO, EU, and Task Force on Community Preventive Services to recommend density regulation as a harm-reduction measure (Ahern et al., 2013). Yet, density effects vary with governance, enforcement, and market behaviour; studies in New Zealand (Connor et al., 2010) and Mexico (Colchero et al., 2022; Romley et al., 2007) show non-linear harm increases at extreme densities, off-licence clustering linked to binge drinking, and price–density interactions that escalate risk (Ahern et al., 2013; Campbell et al., 2009).
In Nairobi’s informal settlements, these dynamics are intensified by an illicit alcohol economy beyond licensing control, where hazardous additives (Carey et al., 2015), entrenched trust in local brewers (Connor et al., 2010; Mwangi, 2020), absence of affordable legal options, and corruption in enforcement (Onyango, 2022) sustain production and supply. NACADA (2015) estimates illicit drinkers consume up to 18.7 litres of pure alcohol annually for men and 7.6 litres for women, with alcohol dependence affecting 4.4% of men and 10.1% meeting criteria for alcohol use disorder, underscoring the urgency of context-specific analysis of market structures such as locally embedded producers versus externally supplied outlets.
In Nairobi’s informal settlements, the persistence of chang’aa, busaa, and other unlicensed beverages could be linked to the duo-embedded informal economies, weak enforcement, and high consumer demand driven by affordability and cultural acceptance (Kipchumba, 2018). Such contexts frequently blur the boundaries between licit and illicit markets, creating overlapping economic and social systems in which informal alcohol trade is not an isolated phenomenon but a parallel market integrated into local livelihoods.
Illicit alcohol markets in urban informal settlements often function within what can be described as dual embeddedness; a structural position where market actors are simultaneously rooted in local socio-economic networks and connected to broader, extra-local supply chains (Röell, Arndt, & Kumar, 2024). In this context, the “producers” and “externally supplied” outlets in Nairobi’s informal settlements reflect two distinct but interdependent forms of embeddedness. The local community network where production, distribution, and consumption are rooted in strong neighbourhood ties, trust-based relationships, and informal protection systems. The broader market ecosystem where these outlets interact with external suppliers, counterfeit distribution channels, and larger illicit trade flows.It highlights that these outlets are not isolated or purely opportunistic, but rather structurally integrated both locally (through self-production, community trust, and embedded social norms) and externally (through linkages to wider illicit supply chains when sourcing from outside).
Producers of illicit alcohol, such as chang’aa and kumi-kumi brewers, are deeply integrated into the immediate informal economy. Their operations rely heavily on community-level relationships, trust, and informal enforcement mechanisms as also noted by Kipchumba (2018). These producers tend to occupy a socio-economic niche, leveraging locally available raw materials, household labour, and informal credit systems. Such embeddedness fosters resilience against external enforcement measures, but also exposes them to fluctuations in local demand, seasonal resource availability, and community pressure (Bodewes, 2010). In contrast, outlets dependent on external suppliers operate within extended illicit supply chains, often linked to regional smuggling networks and counterfeit manufacturing hubs. These networks integrate actors from multiple jurisdictions, exploiting weak regulatory oversight, porous borders, and transnational smuggling operations (Basu, 2013). Their embeddedness is not limited to the local settlement; rather, they are tied to multi-layered logistical flows that connect informal settlements to industrial ethanol diversion, counterfeit packaging plants, and cross-border alcohol inflows (Hilend, Bell, Griffis, & Macdonald, 2023).
The coexistence of producers and externally supplied outlets creates a multi-scalar illicit economy, where control over resources and distribution channels varies significantly between tiers. Producers exert high control over production but have limited reach beyond their immediate locale. Externally supplied outlets sacrifice production control but gain access to broader product ranges, including counterfeit branded alcohol and industrial ethanol derivatives. This division shapes market stability, competitive pressures, and consumer choice as well as resilience against enforcement; since disruption in one tier often triggers adaptive responses in the other (Hilend et al., 2023).
From a theoretical standpoint, dual embeddedness enables the illicit alcohol trade to balance risk and opportunity. Local production embeds illicit alcohol within community livelihoods, making it socially entrenched and difficult to eradicate (Bodewes, 2010). Meanwhile, external supply networks embed the trade within regional and transnational logistics, ensuring continuity of supply despite local crackdowns (Basu, 2013). This mirrors patterns observed in other informal economies where actors sustain operations by simultaneously engaging in place-based and network-based economic systems (Röell et al., 2024).
This study responds to the need for empirical quantification of illicit alcohol’s prevalence and internal market structure in Nairobi’s informal settlements. Two core theoretical claims underpin this investigation. First, illicit alcohol markets in these contexts represent dual-embeddedness within the wider alcohol economy, coexisting at substantial density with licensed outlets as used by Röell, Arndt and Kumar (2024); though in a different context. This challenges regulatory assumptions that illicit alcohol activity exists only at the periphery of formal markets. Second, the dominance of self-production among illicit outlets points to a localised production model in which decentralised, small-scale manufacturing forms the primary supply base. This implies that the illicit economy is largely sustained internally rather than through external supply chains (Basu, 2013; Hilend et al., 2023).
Guided by these claims, the paper aims to: (a) estimate the prevalence rate of illicit alcohol outlets relative to all alcohol-selling premises in Embakasi East Subcounty, and (b) determine the proportion of such outlets that produce their own alcohol compared to those dependent on external sources. These objectives extend existing literature on informal alcohol economies by providing high-resolution, locality-specific prevalence and production metrics, which can inform more theoretical models of informal market functioning.
Methods
Study Design
This cross-sectional study was conducted in the informal settlements of Embakasi East, Nairobi County, Kenya. The study aimed to estimate (i) the prevalence of illicit alcohol outlets within the overall alcohol market ecosystem and (ii) the distribution of illicit alcohol producers between self-producing outlets and those reliant on external supply chains.
Population and Sample
The study population comprised all alcohol-selling outlets operating within the informal settlements of Embakasi East, Nairobi during the study period. The unit of analysis was the outlet, not the customer or proprietor. Outlets included fixed premises (shops, bars, kiosks), semi-permanent structures, and concealed dwelling-based sales points identifiable through signage, product displays, or observable transactions. For the inclusion criteria, any physical outlet retailing alcoholic beverages within the mapped boundaries, regardless of licensing status. Illicit outlets were defined as premises selling unrecorded, counterfeit, or industrial-ethanol–based alcohol or producing unlicensed homemade brews (e.g., chang’aa, kumi-kumi, busaa, kaanga). Legal outlets were those licensed under county and national regulations and selling recorded alcohol. Regarding the exclusion criteria, mobile hawkers without a stable selling point; transient pop-up events; private household consumption without retail sale; and outlets located outside the delineated clusters. Illicit outlets were further classified by supply mode: (i) self-producing (on-site brewing/distillation or repackaging consistent with counterfeit activity) and (ii) externally supplied (stock sourced from off-site producers or distributors). This classification underpinned the second-tier analysis.
Sampling Procedure
The study sampling frame consisted of a complete enumeration of all alcohol-selling outlets identified through systematic block-to-block canvassing, supplemented by key-informant wayfinding and field verification. From this frame, all identified illicit outlets were retained for analysis of production status, while the full set of outlets (legal + illicit) was used for prevalence estimation. An outlet-level survey approach was adopted, targeting all alcohol-selling premises within the defined geographic boundaries. A complete enumeration of outlets was first conducted to establish the sampling frame. The sampling strategy was a census of illicit alcohol outlets identified during this enumeration phase. For the first-tier estimation (prevalence), the observed illicit outlets were compared against the total alcohol outlet population (both legal and illicit) in the study area.
Instrument and Data Collection Procedure
Data were collected using a structured observational checklist, administered by trained field enumerators. The checklist captured outlet type, alcohol legality status, product categories sold, and production origin (self-produced vs. externally sourced). Enumerators also recorded basic quantitative characteristics such as the number of products offered and maximum reported volumes. Observations were supplemented by informal operator interviews to confirm production or sourcing patterns.
Data Analysis
Data from the outlet-level survey were entered, cleaned, and coded prior to analysis. Descriptive statistics were generated to quantify the prevalence of illicit alcohol outlets (Tier 1) and to distinguish between outlets engaged in self-production and those relying on external supply (Tier 2). Tier 1 prevalence was computed as the proportion of illicit alcohol outlets relative to the total number of alcohol outlets, expressed as:
where:
Number of outlets selling illicit alcohol (observed: 118)
Total number of alcohol outlets recorded (observed: 393)
In the second tier, the production–supply split within the illicit market was determined by calculating the proportion of self-producing outlets versus externally supplied outlets. That is producer vs. external Supply Split. The proportion of illicit alcohol producers was estimated as:
and the proportion relying on external suppliers as:
These estimates were derived directly from outlet-level observational records. Conversely, the proportion of externally supplied outlets was obtained by subtracting the producer proportion from 100%. The approach ensured accurate quantification of market structure while enabling visual interpretation of embeddedness dynamics.
Findings
The analysis is organised into two tiers. The first tier quantifies the overall prevalence of illicit alcohol outlets within the broader alcohol market, establishing their proportionate significance in the local retail ecosystem. The second tier disaggregates these illicit outlets by operational model, distinguishing between those engaged in self-production and those dependent on external supply sources.The survey identified a total of 393 alcohol outlets at the study site (Embakasi East). Table 1 presents statistics based on the type of alcohol sold.
| Type of alcohol outlet | Number of outlets | Maximum reported |
|---|---|---|
| Illicit alcohol outlets | 118 | |
| Homemade illicit brew/moonshining (Chang’aa, kumi-kumi, busaa, kaanga, etc.) | 58 | 8 |
| Counterfeited legal alcohol (packaged in branded bottles without KEBS quality mark) | 49 | 6 |
| Decontaminated ethanol intended for industrial use/makeshifts | 11 | 4 |
| Legal alcohol outlets | 275 | |
| Total | 393 |
The survey documented a total of 393 alcohol outlets in Nairobi’s informal settlements, of which 118 (30%) were selling illicit alcohol. Homemade brews, including chang’aa, kumi-kumi, busaa, and kaanga, were the most common illicit type, representing 49% of all illicit outlets. Counterfeited legal alcohol accounted for 42%, while outlets selling decontaminated ethanol comprised 9%. The remaining 275 outlets (70%) were selling legal, indicating a mixed alcohol market where regulated and unregulated sources coexist, thereby increasing community exposure to unsafe alcohol products.
On average, consumers visited illicit alcohol outlets 3.6 times per week, consuming an average of 0.9 litres per visit. The range of consumption varied from 0.1 litres to a maximum of 4 litres per visit, with the frequency of visits ranging from one to five times weekly (Table 2).
| Statistic | Frequency of visits (1–5) | Quantity consumed per visit (litres) |
|---|---|---|
| Mean | 3.6 | 0.9 |
| SD | 1.0 | 0.6 |
| Minimum | 1 | 0.1 |
| Maximum | 5 | 4.0 |
Note. Quantity consumed refers to estimated volume of illicit alcohol consumed per visit.
To obtain the prevalence of illicit alcohol outlets among all in Embakasi East, conversion of the number into proportion values was completed using total number reported then divide by total number of all outlets. The overall prevalence of illicit alcohol outlets can be drawn using the typical average value calculation where the three prevalence is summed up and divided by total frequency count. In this case, the average value is calculated as shown in Formula below:
x 100
*100
30%
Therefore, the overall prevalence of illicit alcohol outlets stands at 30%. The prevalence can be inferred in terms of accessibility and exposure of illicit alcohol beverages to the entire population. To estimate the total number and prevalence of illicit alcohol producers out of the 118 outlets in Embakasi East, conversion of the number into proportion values was completed using total number reported then divide by total number of outlets. The findings are provided in Figure 1 and Table 3.
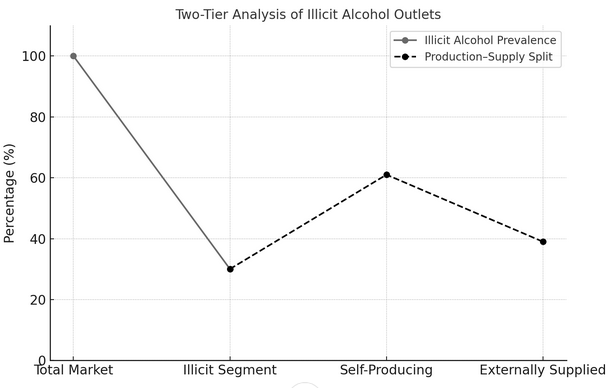
Figure 1 illustrates two distinct but interconnected dynamics within Embakasi East’s illicit alcohol market. The first line shows that illicit alcohol outlets constitute 30% of the total alcohol retail network, indicating a substantial parallel market presence. The second line demonstrates that within this illicit segment, a higher proportion engage in self-production compared to those sourcing from external suppliers, underscoring the dominance of locally embedded production systems.
| Category (within illicit outlets, N = 118) | Assumption A: “Producer” includes homemade, counterfeit (repackaging), and ethanol–makeshift | Assumption B (conservative): Only homemade and ethanol–makeshift count as “producers”; counterfeit counted as external |
|---|---|---|
| Total producer outlets, n (%) | 104 (88.1%) | 89 (75.4%) |
| — Homemade producers (from 43.6%) | 51 | 51 |
| — Counterfeit producers (from 12.6%) | 15 | — |
| — Ethanol–makeshift producers (from 31.9%) | 38 | 38 |
| Externally sourced (non-producing) outlets, n (%) | 14 (11.9%) | 29 (24.6%) |
Notes. Projections apply previously reported producer prevalence (43.6% homemade; 12.6% counterfeit; 31.9% ethanol–makeshift) to the 118 illicit outlets. Assumption A treats counterfeit repackaging as production; Assumption B treats counterfeit as externally sourced. Categories are treated as mutually exclusive due to absent overlap data.
As presented in Table 3, under a broad definition that counts counterfeit repackaging as production (Assumption A), about 104 of 118 illicit outlets (88.1%) are producers; only 11.9% rely on external supply.Under a conservative definition that limits “producer” to homemade and ethanol–makeshift (Assumption B), about 89 outlets (75.4%) are producers; 24.6% source externally.In both cases, on-site production predominates, led by homemade and ethanol–makeshift operations.
Discussion
Discussion
This study set out to (1) estimate the prevalence of illicit alcohol outlets in Nairobi’s informal settlements and (2) determine how many of those outlets produce alcohol themselves versus relying on external sources. These objectives underpin two theoretical claims: first, that illicit alcohol markets are dually embedded in community economies forming sizable, parallel structures to formal markets; and second, that these markets are sustained primarily through localized self-production (not external supply), challenging assumptions about passive resale models.
Findings reveal that of 393 total alcohol-selling outlets in Embakasi East, 118 (30%) are illicit (Table 1). This indicates that nearly one in three alcohol outlets operates outside the formal regulatory framework, confirming the dual-embeddedness claim. This prevalence is not marginal it signifies structural integration of informal alcohol economies within local market ecologies. Thus, this aligns with research by Mkuu et al. (2018), who found that in Nairobi slums, up to 50.3% of alcohol consumption is unrecorded homemade brews, grounded in informal economies. Similarly, in a comparative urban study, Mukupa et al. (2024) reported illicit alcohol sources as comprising 28–35% of all outlets in peri-urban settlements in East Africa. These figures resonate with this papers findings, reinforcing that informal alcohol is a persistent structural feature of urban underserved communities.
Within the 118 illicit outlets, projections suggest that 75–88% serve as local producers (Table 2). Under Assumption A including homemade, counterfeit production, and ethanol-based makeshift operations about 104 outlets (88.1%) are producing their own alcohol; only 11.9% source externally. Under Assumption ‘B’ excluding counterfeit repackagers; 89 outlets (75.4%) produce locally; 24.6% rely on external supply. Either way, production is the dominant mode. These findings strongly support the localised production model where illicit alcohol supply is rooted in endogenous manufacturing rather than passive resale. This challenges models assuming illicit outlets are essentially informal retailers of otherwise distributed supply.
Recent studies reinforce this view. Kinyundo and Wachiuri, (2025) found that homemade alcohol producers in Kenyan informal settlements accounted for more than 70% of local alcohol production, and were frequently implicated in methanol poisoning cases, unlike resale outlets. Kipchumba (2018) demonstrated that production hubs (small-scale distilleries) were more closely associated with acute alcohol-related harm in slum areas than peripheral retail points. Kamau and Muna (2025) found that stringent licensing barriers pushed producers underground, resulting in hyper-local supply chains largely disconnected from formal distribution networks. That such a high proportion of illicit outlets produce their content underscores the economic agency of local actors. Informal producers sustain demand and distribution without relying on external supply chains. This supports theories of informal economic resilience, where marginalised communities create self-reliant supply networks to meet demand in the absence of formal services (Hossain et al., 2022).
Localised production concentrates risk geographically and socially. Research by Gitatui et al., (2019) in Kenya showed that residents living within 500 meters of a homemade alcohol producer had 1.8 times higher rates of alcohol-related hospital admissions than those closer to retail-only outlets. This suggests that production not only increases availability but also amplifies health risks in proximity. Thus, the stability of local production networks evidenced by high prevalence and weekly consumption (mentioned in results) suggests embedded, resilient systems that may persist despite enforcement or policy shifts. This supports economic theory suggesting that informal markets, when rooted in localised infrastructure and social capital, demonstrate robustness to external shocks.
Conclusion
This paper set out to examine the prevalence and structural composition of illicit alcohol outlets in Embakasi East, with two interlinked objectives: first, to quantify the proportion of such outlets within the broader alcohol retail ecosystem; and second, to determine the extent to which these outlets engage in self-production versus reliance on external suppliers. Guided by the theoretical propositions of dual embeddedness that illicit outlets function as integral, not peripheral, components of the alcohol market and localised production dominance that self-production is the prevailing model in the illicit sector the study sought to advance an empirical understanding of the operational logics underpinning informal alcohol economies.The findings strongly support both claims.
The estimated prevalence of illicit alcohol outlets at 30% of the total market substantiates the notion of dual embeddedness, revealing a parallel commercial infrastructure deeply integrated into the local economy. Furthermore, the predominance of self-producing outlets, as opposed to reliance on external industrial or clandestine suppliers, affirms the localised production dominance thesis. This divergence from the conventional policy assumption of supply-chain-driven illicit markets reframes the issue: the primary dynamics are embedded in community-level production systems rather than in transnational or large-scale distribution networks.
These insights contribute to a growing body of literature that conceptualises informal markets not as residual or purely opportunistic spaces, but as structured economic adaptations with spatial, social, and technical coherence. They advance the study of illicit economies by underscoring the importance of micro-level production ecologies and their embeddedness within community trust, risk-sharing norms, and adaptive governance mechanisms.From a macroeconomic perspective, the implications are twofold. First, the scale and resilience of illicit alcohol production signify that informal market systems can achieve significant market penetration without dependence on formal supply infrastructures, challenging orthodox supply-side interventions. Second, the persistence of such markets, despite formal prohibitions, highlights the economic rationality of informality in contexts of poverty, regulatory asymmetry, and high consumer demand elasticity.
Limitations
This study’s primary limitation lies in its reliance on observational data from a cross-sectional outlet-level survey, which couldn’t fully capture covert or transient operators. Self-production estimates are based on reported or observable indicators, potentially underestimating concealed sourcing practices. The geographic focus on Embakasi East limits generalisability to other urban or rural contexts.
References
Rights and permissions

Disclaimer
Publisher’s note
Additional information
Data availability
Acknowledgements
Funding
Peer review
Article Timeline
Cite this article
- Received
- July 24, 2025
- Revised
- August 24, 2025
- Accepted
- September 2, 2025
- Published
- September 8, 2025
- Version of record
- September 8, 2025
Share this article
Copy the canonical link to share this article with colleagues and readers.
Discover more research

Recent Publications

Most Read

Recommended
Save this article as a bookmark
Use your browser’s secure bookmark shortcut. Both desktop options are shown below.
Press Ctrl+D
In Chrome, Edge or Firefox, choose a folder if needed, then select Done.
Press ⌘ Command+D
In Safari, Chrome or Firefox, choose the bookmark location and confirm.
Cite this article
Copy a formatted citation or download a reference file.
Cited by
Crossref citation count for this DOI.