

Abstract
This paper compares corporate taxation in Kenya and Uganda for the fiscal year 2024/2025. The objectives were threefold: to review the corporate tax frameworks of each country, to test for numerical differences in key parameters, and to examine sectoral implications. Data were drawn from secondary sources, including the Finance Act 2025 (Kenya), the Income Tax (Amendment) Bill 2025 (Uganda), and PwC/KPMG tax summaries. Using descriptive tabulation and Welch’s unequal variance t-test, the study finds significant differences in statutory provisions. Uganda applies higher excises, withholding taxes, and capital gains charges, while Kenya offers more investor-friendly measures, notably indefinite loss carry-forward and lower dividend withholding. These disparities carry sectoral effects: Uganda’s fuel excises increase costs for automobile and FMCG sectors, whereas Kenya’s reinvestment incentives enhance competitiveness in energy and agribusiness. The findings confirm that corporate tax differences shape trade and investment outcomes, highlighting the need for regional coordination.
1. Introduction
1.1 Background to Taxation and Corporate Tax
Taxation constitutes one of the most significant instruments of statecraft, not only as a mechanism for financing public expenditure but also as a means of shaping investment incentives, market structures, and cross-border trade flows (Musgrave, 1959; Stiglitz & Rosengard, 2015). Within Sub-Saharan Africa, corporate taxation has gained increasing importance as countries seek to balance revenue mobilisation with competitiveness in attracting foreign direct investment (FDI). The East African region, in particular, is characterized by diverse yet interconnected fiscal regimes, where harmonisation remains a policy ambition under the East African Community (EAC) framework. Kenya and Uganda provide a compelling comparative case, given their geographical proximity, intertwined trade relations, and shared membership in regional economic blocs, while nonetheless pursuing tax policies that diverge substantially in scope and design (Auerbach, Devereux, & Simpson, 2010; PwC, 2025; URA, 2022).
The historical trajectory of taxation in East Africa reflects colonial legacies, post-independence reforms, and contemporary fiscal consolidation drives. Uganda’s tax system has traditionally leaned toward heavy reliance on excise duties and broader consumption taxes, reflecting a need for stable revenue collection amidst a narrower industrial base. Kenya, by contrast, has pursued a mix of broad-based income taxation and sector-specific incentives, particularly in energy and manufacturing, designed to attract investment and stimulate domestic industrialisation (Finance Act, 2025; KPMG, 2025). These divergent philosophies have created asymmetries that are directly experienced by businesses operating across borders. For instance, while Uganda applies a relatively high capital gains tax and levies such as payroll and environmental contributions, Kenya’s system allows indefinite loss carry-forward and lighter capital taxation, reflecting different policy trade-offs between fiscal certainty and investment stimulation.
Corporate tax systems are particularly influential in shaping the investment climate. High statutory rates can disincentivise foreign direct investment (FDI), while excessive incentives may erode the tax base and compromise fiscal sustainability (OECD, 2022). Consequently, striking an optimal balance between competitiveness and revenue sufficiency remains a perennial policy challenge, especially for developing economies that rely heavily on corporate taxation as a share of total tax revenue (IMF, 2021).
1.2 Historical Development of Taxation in East Africa
The origins of taxation in East Africa are deeply rooted in the colonial economy. In both Kenya and Uganda, taxation was initially designed as an extractive mechanism to sustain the colonial administration and facilitate resource transfer to Britain (Berman & Lonsdale, 1992). Instruments such as hut tax and poll tax were deployed less as tools of fiscal policy and more as coercive measures to integrate African households into cash economies, thereby ensuring labour supply for settler agriculture and infrastructure projects.
Following independence in the early 1960s, both states inherited tax systems that were narrow in base and administratively weak. The post-independence governments sought to restructure taxation to support industrialisation and public service delivery (Muriithi & Moyi, 2003). However, pervasive inefficiencies, corruption, and structural economic shocks in the 1970s and 1980s undermined revenue performance. In response, both countries introduced comprehensive reforms in the 1990s, including the establishment of semi-autonomous revenue authorities: the Kenya Revenue Authority (KRA) in 1995 and the Uganda Revenue Authority (URA) in 1991 (Therkildsen, 2004). These reforms modernised tax administration, enhanced compliance, and broadened the tax base, although challenges of evasion, informality, and administrative capacity persist (Fjeldstad & Heggstad, 2012).
1.3 Kenya and Uganda in Regional Perspective
Kenya and Uganda share profound economic, historical, and institutional linkages. As founding members of the East African Community (EAC), both states are committed to deeper regional integration encompassing a customs union, common market, and eventual monetary union (EAC Secretariat, 2017). Their economies are structurally similar: agriculture remains the backbone of rural employment and exports, while manufacturing and services are expanding. Both states are also pursuing ambitious infrastructure and energy projects to stimulate industrial growth (World Bank, 2020).
Despite these convergences, their corporate tax regimes diverge significantly in structure and emphasis. For instance, while both maintain a headline corporate tax rate of approximately 30 percent, Uganda provides comparatively broader tax incentives in priority sectors such as energy and agro-processing, whereas Kenya maintains a more complex system of sector-specific exemptions and investment deductions (URA, 2022; KRA, 2022). These divergences create asymmetries in effective tax burdens, potentially distorting cross-border trade and investment flows within the EAC.
Against this backdrop, the role of taxation in influencing sectoral outcomes becomes apparent. The automobile industry, highly sensitive to excise duties on fuel and import taxes, is shaped differently in Uganda and Kenya due to cost differentials in logistics. The energy sector illustrates a further divergence, with Kenya incentivising solar and renewable technologies through tax exemptions, while Uganda sustains higher petroleum excises to safeguard fiscal stability. In agriculture, Uganda’s heavier taxation generates revenue but risks constraining agro-processing competitiveness, while Kenya’s lighter incentives promote value addition at the expense of revenue predictability. The FMCG sector similarly reflects this trade-off, where Uganda emphasises predictable statutory levies, while Kenya privileges business reinvestment through indefinite loss carry-forwards. These differences underscore taxation’s dual function as both a fiscal and industrial policy tool (IMF, 2023; Tabitha et al., 2025).
This paper therefore claims that corporate tax disparities between Kenya and Uganda hold significant implications for cross-border trade, investment decisions, and sectorial development outcomes. The problem driving the inquiry is the absence of a rigorous comparative analysis that integrates legal frameworks, numerical tax metrics, and sector-specific implications to determine whether these differences are not only policy-relevant but also statistically significant. The objective of the paper is threefold: first, to review the corporate tax frameworks of Kenya and Uganda, highlighting similarities and differences in statutory indicators; second, to conduct a statistical comparison of key corporate tax metrics to test whether a significant difference exists; and third, to analyse the implications of these tax differentials for specific business sectors automobile, energy, agriculture/agro-processing, and FMCGs. The central hypothesis guiding the quantitative test is that there exists a statistically significant difference in the average magnitude of corporate tax parameters between Uganda and Kenya, reflecting distinct fiscal policy orientations.
1.4 Problem Statement
Although taxation is central to both fiscal policy and trade integration, limited scholarly attention has been devoted to country-specific comparative analyses of corporate tax regimes in East Africa. Much of the literature focuses either on regional tax harmonisation in general terms (Keen & Mansour, 2010) or on single-country fiscal performance (Mwenda, 2006). Much of the existing scholarship on East African taxation has traditionally privileged either legal perspectives or economic perspectives in isolation (Fjeldstad & Moore, 2009). As a result, there is a paucity of empirical evidence on how corporate tax differences between Kenya and Uganda shape investment incentives, compliance costs, and trade competitiveness. Further, this gap is particularly salient given the EAC’s explicit goal of fiscal harmonisation, which requires convergence of tax structures to facilitate free movement of goods, services, and capital (EAC Secretariat, 2017). Without empirical clarity on the magnitude and implications of tax disparities, policymakers may struggle to design effective reforms. Investors operating across the two jurisdictions likewise face uncertainty in navigating divergent regimes, which may hinder intra-regional business expansion.
1.5 Hypothesis Statement
In pursuit of the second objective, this paper is guided by the following statistical hypothesis. The null hypothesis (H₀) states that there is no statistically significant difference in the mean corporate tax parameter values between Uganda and Kenya, expressed formally as; H0: μUG=μKE. In contrast, the alternative hypothesis (H₁) posits that a statistically significant difference does exist, such that the average corporate tax burden in the two countries is unequal, represented as; H1: μUG≠μKE. This formulation is appropriate because the study does not assume beforehand which country’s tax regime is heavier on aggregate, but rather tests empirically whether the observed disparities in statutory tax parameters amount to a meaningful statistical difference.
2. Methods
2.1. Sample
The analytical population comprises statutory, corporate-facing tax parameters in Kenya and Uganda that were in force or formally proposed for the fiscal window spanning FY 2024/2025 to FY 2025/2026. Because these parameters are enacted values rather than stochastic observations, the study treats them as a complete set of policy indicators rather than a probabilistic sample. Inclusion was limited to numeric provisions with direct corporate incidence across five canonical categories value-added tax (VAT), import duties and excise, stamp duty, withholding tax (WHT), and other corporate-related levies as reported in authoritative compilations and primary instruments: PwC Tax Summaries for Uganda and Kenya (2025), the Uganda Revenue Authority taxation handbook (2022), Uganda’s 2024/25 and 2025 tax amendment documents and bill memoranda, and Kenya’s Finance Act, 2025 and professional syntheses (KPMG, 2025). Non-numeric narrative text, administrative procedures, compliance timelines, and purely individual (non-corporate) provisions were excluded from statistical construction, though they informed the qualitative discussion and notes (PwC, 2025; URA, 2022; Finance Act, 2025; KPMG, 2025; URA Amendments 2024/25; Income Tax (Amendment) Bill 2025).
2.2. Data
All numeric values were extracted from the cited documents and aligned category-by-category to ensure cross-country comparability. Where amounts were denominated in local currency (UGX or KES), they were converted to USD using fixed conversion factors adopted for this study to achieve a common numeric for threshold-type provisions: UGX 3,800 = USD 1 and KES 135 = USD 1. This conversion was applied consistently to all money-denominated parameters (e.g., VAT registration thresholds; specific excise per litre), producing a pair of vectors per country consisting exclusively of numeric entries. The final indicators included, inter alia, the standard VAT rate and registration threshold (USD), specific excises on petrol and diesel (USD per litre), ad valorem excises on beer and spirits (percent where specified), general stamp duty and selected instruments (percent), WHT rates on dividends, interest, royalties, technical/management fees, WHT on contractors (resident and non-resident), capital gains tax, payroll/training or housing levy rates, environmental levy rates, and the statutory loss carry-forward horizon.
For Kenya’s “indefinite” loss carry-forward, a large finite proxy of 99 years was encoded to preserve the order of generosity in the statistical vector while acknowledging that “indefinite” is not a cardinal quantity; this coding choice is disclosed as a limitation and is addressed in the interpretation caveat. Where a parameter could be expressed in alternative bases (e.g., both a specific per-unit rate and an ad valorem percentage), the value used was the predominant statutory basis reported for that country in the source at the time (PwC, 2025; URA, 2022). The constructed dataset thus comprises two aligned vectors of equal length, one for Uganda and one for Kenya, each entry representing a single statutory parameter.
2.3. Model
The empirical objective is to assess whether the average magnitude of corporate-facing statutory parameters differs between the two regimes. Let denote the number of aligned indicators retained after applying the inclusion and exclusion criteria. For each country , define the vector of numeric parameters
where is the numeric value of the -th tax parameter (for example, VAT rate in percent; VAT registration threshold in USD; petrol excise in USD/litre; diesel excise in USD/litre; beer excise in percent; ...; loss carry-forward horizon in years). The country-level mean statutory magnitude is
and the sample variance is
To test for a difference in means, we employ the Welch two-sample -test, which does not assume equal variances and is therefore appropriate for heteroskedastic constructs such as mixed tax parameters expressed on different numeric scales (percentages, USD levels, and years). The test statistic is
with Welch-Satterthwaite degrees of freedom
We test the two-sided null against at . The aggregated values displayed in the statistical chart-namely the per-country mean and standard deviation-are exactly and computed from the aligned vectors. Correspondingly, the reported confidence interval for the mean difference is
where is the two-sided critical value from the distribution with the Welch-Satterthwaite df. We selected Welch's rather than Student's because the variance of statutory magnitudes plausibly differs across countries due to composition (e.g., Kenya's very long loss carry-forward horizon and lighter CGT versus Uganda's higher excises and heavier CGT).
A key measurement caveat is dimensional heterogeneity: the vector contains percentages, dollar amounts, and years. This design intentionally preserves the absolute fiscal scale that firms face in practice but can weight the mean toward large-scale items (e.g., VAT thresholds in USD). For transparency, the study reports and interprets the raw-scale results used in the chart and test. A robustness path-appropriate for an appendix in a journal submission-is to standardize each indicator within the pooled sample using scores, , and to re-estimate Welch's test on the standardized vectors to verify that the direction and significance of the difference are not an artefact of units. Because the statutory parameters are not random draws, all inferential claims are framed as illustrative comparisons of indicator sets, a standard approach when policy indicators are contrasted across jurisdictions (PwC, 2025; URA, 2022; Finance Act, 2025; KPMG, 2025).
3. Results
3.1. Legal and Policy Frameworks Governing Tax
Kenya
The Finance Act, 2025, introduces a significant amendment to the Income Tax Act by broadening the definition of income derived from Kenya to include payments made through a digital marketplace (Grant Thornton, 2025). This is a direct legislative action in response to the policy challenge of taxing the digital economy (National Treasury, 2023). This new provision, which works in conjunction with the withholding tax introduced by the Tax Laws (Amendment) Act, 2024, means that non-resident service providers earning income from Kenyan users will be subject to tax regardless of their physical location (Grant Thornton, 2025).
The Kenya Revenue Authority (KRA) is the statutory body responsible for tax administration (Ronalds LLP). Kenya’s tax policy document acknowledges that the system faces challenges of low tax compliance and complexities in taxing the growing informal sector and new online businesses (National Treasury, 2023). This has prompted a series of legislative and administrative reforms.
The amendment of the Value Added Tax Act through the Finance Act, 2025, provides further evidence of the ongoing effort to adapt the tax system to evolving economic realities (Bowmans, 2025). The removal of VAT exemptions for certain items and the imposition of VAT on goods used in a manner inconsistent with their exemption purpose demonstrate a concerted effort to close tax loopholes and increase the tax base (Bowmans, 2025). However, the same Act also introduced new exemptions for socially or economically significant items like mosquito repellent and its manufacturing inputs (Bowmans, 2025). This demonstrates a complex balancing act where the government attempts to increase revenue while simultaneously using tax policy to address social concerns and reduce the cost of living, as outlined in the BETA agenda (National Treasury, 2023). The reduction of the VAT refund timeline on bad debts from three years to two years also streamlines administrative processes and improves cash flow for taxpayers (Bowmans, 2025).
Kenya’s National Tax Policy is the cornerstone of its tax framework, setting out a strategic vision for tax administration and legislation and marking a shift from an ad-hoc to a more transparent, deliberate approach (National Treasury, 2023). It aligns with the Fourth Medium-Term Plan (2023–2027) under Kenya Vision 2030 and the Bottom-Up Economic Transformation Agenda (BETA), linking tax reforms to goals such as reducing the cost of living, boosting employment, incentivising investment, ensuring equitable income distribution, strengthening social security, broadening the tax base, and increasing foreign exchange earnings (National Treasury, 2023). The policy also addresses systemic challenges, including rising tax expenditure, low compliance, and complexities in taxing digital economies, and delayed dispute resolution, by promoting transparency, predictability, and stability in the tax system (National Treasury, 2023). Among its proposals is a five-year review cycle of tax laws to ensure a consistent and predictable fiscal environment. This structured framework positions tax policy as a central pillar of Kenya’s economic strategy, creating a clear link between strategic objectives and legislative action (National Treasury, 2023).
Kenya’s tax system, administered by the Kenya Revenue Authority (KRA), is composed of both direct and indirect taxes (Ronalds LLP). Direct taxes are governed by the Income Tax Act (Cap 470) (KRA, 2021) and include Corporate Income Tax (CIT), charged at 30% for resident companies and 37.5% for non-residents, with incentives such as a reduced 15% rate for certified Nairobi International Financial Centre companies for the first ten years (KPMG, 2021; PwC; Bowmans, 2025). Personal Income Tax (PIT) is progressive with a top marginal rate of 35% and includes personal relief under PAYE (PwC; Ronalds LLP). Withholding Tax (WHT) applies to income like dividends, interest, and royalties, with varying rates by residency, and winnings from betting are subject to 5% WHT on withdrawals (Ronalds LLP; Bowmans, 2025). Other direct taxes include Capital Gains Tax at 15% and Turnover Tax at 1% for incomes between KES 1 and 50 million (KPMG, 2021; PwC). Indirect taxes, levied on consumption, include Value Added Tax (VAT) at 16%, with recent Finance Act 2025 reforms removing exemptions in manufacturing and healthcare to expand the tax base (Bowmans, 2025). Customs duties are governed by the EAC-CMA, while excise duties apply to specific local or imported goods, with the Finance Act 2025 revising gaming excise duty to 5% on deposits rather than wagers (Ronalds LLP; National Treasury, 2023; Bowmans, 2025).
Uganda
In Uganda, the constitutional basis for taxation is established by the principle that no tax may be imposed except under the authority of an Act of Parliament, ensuring democratic legitimacy for all tax laws (URA, 2022). The Uganda Revenue Authority Act provides the administrative framework for collection, with the Uganda Revenue Authority (URA) guided by canons of taxation that emphasize fairness, convenience, certainty, economy, simplicity, and the ability to pay (URA, 2022). These principles require that taxes be levied progressively in line with income (equity), collected without undue difficulty (convenience), applied with clarity regarding liability (certainty), administered at minimal cost (economy), designed to be easily understood (simplicity), and limited so as not to exceed a person’s taxable income (ability to pay) (URA, 2022).
Uganda’s tax system consists of direct and indirect taxes, with reforms aimed at broadening the base and simplifying administration. Corporate Income Tax (CIT) is charged at 30% for both resident and non-resident companies (Werksmans Attorneys, 2013). Individual income tax is progressive, exempting monthly earnings up to UGX 235,000, applying multiple brackets, and adding a 10% surcharge on income above UGX 10 million (Werksmans Attorneys, 2013; URA, 2022). Withholding Tax (WHT) applies to payments such as professional fees, dividends, and non-resident contractor fees, with the Income Tax (Amendment) Bill, 2023 introducing a final 5% WHT on gross payments for assets in Uganda, thereby removing exemptions on listed shares and personal property to simplify capital gains taxation (URA, 2022; Grant Thornton, 2023). A presumptive tax applies to small businesses earning between UGX 5 million and UGX 150 million annually to ease compliance for low-income taxpayers (URA, 2022). Indirect taxes include Value Added Tax (VAT) at 18% on most goods and services, with mandatory registration for businesses exceeding UGX 150 million turnover (PwC; URA, 2022; Trade.gov, 2023), and excise duty on selected products such as alcohol and cigarettes (URA, 2022).
Recent and proposed legislative reforms in Uganda reflect a deliberate effort to modernise the tax system and expand revenue collection. The Income Tax (Amendment) Bill, 2023, introduces a 5% Digital Service Tax (DST) on non-residents providing online services such as Facebook, Netflix, and Google, signalling the government’s intent to capture revenue from the growing digital economy (Grant Thornton, 2023; Trade.gov, 2023). The same bill also proposes repealing the initial allowance on plant, machinery, and industrial buildings, eliminating the 50% first-year deduction that had incentivised capital-intensive investment an indication of a policy shift towards short-term revenue mobilisation over long-term investment attraction (Grant Thornton, 2023). Complementing these measures, the Tax Procedures Code (Amendment) Bill, 2025, seeks to streamline administration by integrating national identification numbers with tax identification numbers and establishing a centralised payment gateway for the gaming and betting sector, alongside penal taxes for non-compliance (Parliament of Uganda, 2025). Table 1 presents a matrix of the similarities, differences, and gaps in the legal and policy frameworks of Uganda and Kenya.
| Aspect | Similarities | Differences | Gap Analysis |
|---|---|---|---|
| Strategic Policy | Both seek to expand tax bases and raise tax-to-GDP ratios (National Treasury, 2023; URA, 2022). | Kenya has a formal National Tax Policy linked to BETA (National Treasury, 2023), while Uganda relies on incremental reforms via annual finance bills (URA, 2022; Grant Thornton, 2023; Parliament of Uganda, 2025). | Kenya’s structured approach offers predictability, while Uganda’s incremental model creates uncertainty for long-term planning. |
| Digital Economy Taxation | Both recognise the digital economy as a revenue source (National Treasury, 2023; Grant Thornton, 2023; Trade.gov, 2023). | Kenya amended its Income Tax Act to tax digital marketplace payments (Grant Thornton, 2025), while Uganda proposes a 5% DST on non-resident providers (Grant Thornton, 2023; Trade.gov, 2023). | Divergent methods create complexity for cross-border digital businesses. |
| Corporate Tax & Incentives | Both apply a 30% corporate tax rate (KPMG, 2021; PwC; Werksmans Attorneys, 2013). | Kenya offers incentives like a 15% rate for Nairobi International Financial Centre firms (Bowmans, 2025), while Uganda seeks to repeal the initial allowance on plant and machinery (Grant Thornton, 2023). | Different incentive regimes affect regional competitiveness and FDI attraction. |
| Capital Gains Taxation | Both levy capital gains taxes (KPMG, 2021; PwC; Grant Thornton, 2023). | Kenya applies a 15% CGT on property transfers (KPMG, 2021; PwC), while Uganda proposes a simplified 5% final WHT on all asset transfers (Grant Thornton, 2023). | Uganda’s simplified approach diverges sharply from Kenya’s, creating harmonisation challenges. |
| Regional Integration | Both are EAC members with harmonised customs under EAC-CMA and SCT (National Treasury, 2023; URA, 2022). | Strong customs integration but divergent domestic tax policies, especially on digital and incentives. | Customs success shows potential, but domestic tax coordination remains limited. |
The analysis in Table 1 reveals that while Kenya and Uganda share similar fiscal goals and are both actively modernising their tax administration, their strategic policy approaches and legislative specifics diverge significantly. Kenya's framework is more transparently policy-driven and focused on a long-term agenda, whereas Uganda's appears more responsive to immediate revenue needs through incremental legislative changes. A notable gap exists in the harmonisation of domestic tax policies, particularly in the rapidly evolving digital economy and in the use of investment incentives. This divergence, while allowing for national fiscal sovereignty, creates a complex and less predictable environment for cross-border businesses, potentially hindering the full economic benefits of regional integration.
3.2. Comparative Corporate Taxes
| Uganda | Kenya | USD Equivalent | GDP-Adjusted Impact* | |
|---|---|---|---|---|
| Standard VAT rate | 18% | 16% | N/A | N/A |
| Registration threshold | UGX 150,000,000 ≈ USD 39,474 | KES 5,000,000 ≈ USD 37,037 | UG: 39,474; KE: 37,037 | UG: 3.29× GDP pc; KE: 16.1× GDP pc |
| Imported services VAT | 18% | 16% | N/A | N/A |
| Zero-rated supplies | 0% | 0% | N/A | N/A |
| Refund period | Not specified | Reduced 24 → 12 months | N/A | N/A |
| Bad debt relief | Not specified | Reduced 3 years → 2 years | N/A | N/A |
| Penalty for late filing | 2% per month | 5% of tax due or KES 10,000 ≈ USD 74 | KE: 74; UG recurrent | Burden heavier in UG (recurrent) |
- Notes:
- GDP-adjusted impact = tax amount ÷ GDP per capita (Kenya ≈ USD 2,300; Uganda ≈ USD 1,200, World Bank 2025).
- Uganda’s VAT registration threshold is lower relative to national income, meaning smaller firms enter VAT net earlier than in Kenya.
- Penalty structure in Uganda is percentage-based and compounds monthly, potentially harsher than Kenya’s fixed minimum fine.
- Sources: PwC (2025) Uganda Corporate – Other Taxes; PwC (2025) Kenya Corporate
Table 2 shows that Uganda’s standard VAT rate (18%) is slightly higher than Kenya’s (16%). However, Uganda’s registration threshold, when adjusted for GDP per capita, is lower, meaning that smaller firms in Uganda are more likely to be drawn into VAT compliance compared to Kenya. Penalties also differ, with Uganda imposing a recurring percentage-based charge, while Kenya applies a fixed minimum fine.
| Uganda | Kenya | USD Equivalent | GDP-Adjusted Impact* | |
|---|---|---|---|---|
| Import duty (general, EAC CET) | 0%, 10%, 25% | 0%, 10%, 25% | N/A | N/A |
| Petrol excise per litre | UGX 1,450 ≈ USD 0.38 | KES 21.95 ≈ USD 0.16 | UG: 0.38; KE: 0.16 | UG: 0.032% vs KE: 0.007% |
| Diesel excise per litre | UGX 1,130 ≈ USD 0.30 | KES 19.40 ≈ USD 0.14 | UG: 0.30; KE: 0.14 | UG: 0.025% vs KE: 0.006% |
| Airtime/telecom excise | 12% | 20% | N/A | Relative burden higher in UG (lower ARPU) |
| Beer excise | 60% or UGX 2,050/l ≈ USD 0.54 | 10% or KES 22.40/l ≈ USD 0.17 | UG: 0.54; KE: 0.17 | UG: 0.045% vs KE: 0.007% |
| Spirits excise | 80% or UGX 4,100/l ≈ USD 1.08 | 35% of value | UG: 1.08; KE: variable | UG: 0.09% vs KE: lower (value-based) |
Notes:
- Uganda relies more on specific excises (per litre/unit) while Kenya mixes specific and ad valorem (value-based) excises.
- In GDP-adjusted terms, excises are 3–5× heavier in Uganda.
- Exchange rates applied: UGX 3,800 = USD 1; KES 135 = USD 1 (World Bank 2025).
- Sources: PwC (2025) Uganda Corporate – Other Taxes; PwC (2025) Kenya Corporate
Both countries apply the common EAC tariff bands of 0%, 10%, and 25%. Excise structures, however, diverge: Uganda relies more on specific excises per litre or unit, while Kenya uses a mix of specific and ad valorem rates. In dollar terms, excises on fuel, beer, and spirits are higher in Uganda, and when adjusted for GDP per capita, they represent a substantially larger burden on Ugandan consumers relative to Kenyan consumers. Telecom excises, while higher in Kenya at 20%, remain less regressive when income differences are considered.
| Uganda | Kenya | USD Equivalent | GDP-Adjusted Impact* | |
|---|---|---|---|---|
| General rate | 1% of transaction value | 1% of transaction value | N/A | N/A |
| Mortgages/charges | 0.5% | 0.1% | N/A | N/A |
| Leases | 1% | 2% | N/A | N/A |
Notes:
Both countries impose 1% stamp duty on general transactions.
Kenya is stricter on leases (2%) while Uganda is stricter on mortgages (0.5% vs 0.1%).
GDP impact is transaction-sensitive (relative to property markets).
Sources: PwC (2025) Uganda Corporate – Other Taxes; PwC (2025) Kenya Corporate – Other Taxes.
Stamp duty structures are broadly similar, with a standard rate of 1% on general transactions in both countries. Specific instruments reveal divergence: Uganda applies higher rates on mortgages and charges, whereas Kenya applies a higher rate on leases.
| Parameter | Uganda | Kenya | USD Equivalent | GDP-Adjusted Impact* |
|---|---|---|---|---|
| Dividends | 15% (residents & non-residents) | 5% (residents), 15% (non-residents) | N/A | Higher resident burden in UG |
| Interest | 15% | 15% | N/A | Equal nominally |
| Royalties | 15% | 20% | N/A | Higher in Kenya |
| Management/technical fees | 15% | 20% | N/A | Higher in Kenya |
| Contractors | 6% (residents), 15% (non-residents) | 3% (residents), 20% (non-residents) | N/A | Lower in UG for residents; higher in KE for non-residents |
- Notes:
- Uganda applies uniform WHT 15% across several categories, while Kenya differentiates by residency status.
- Kenya’s higher royalties and service fees WHT (20%) may discourage foreign intellectual property and consultancy inflows.
Sources: PwC (2025) Uganda Corporate – Other Taxes; PwC (2025) Kenya Corporate
Uganda applies a uniform 15% rate across dividends, interest, royalties, and technical fees, while Kenya differentiates by residency status and applies higher rates on royalties and services. As a result, Uganda’s framework places a heavier burden on resident dividend distributions, whereas Kenya imposes higher costs on foreign intellectual property and consultancy inflows.
| Uganda | Kenya | GDP-Adjusted Impact* | |
|---|---|---|---|
| Capital gains tax (CGT) | 30% (part of corporate tax) | 5% standalone on net gain | Heavier in Uganda |
| Payroll/training levy | 2% of gross salaries | 1.5% Housing Levy on gross salaries | Heavier in Uganda |
| Environmental levy | 2% on plastic imports | Not specified in 2025 Act | Burden unique to UG |
| Loss carry-forward | Up to 7 years | Indefinite | More generous in KE |
Notes:
Uganda incorporates capital gains into the 30% corporate tax rate, while Kenya has a lighter standalone 5% CGT.
Payroll levies are heavier in Uganda. Kenya’s levy is earmarked for housing, Uganda’s for training.
Loss carry-forward is stricter in Uganda (7 years) compared to Kenya (indefinite).
Sources: PwC (2025) Uganda Corporate – Other Taxes; PwC (2025) Kenya Corporate – Other Taxes; URA Tax Handbook.
In non-VAT and excise categories, Uganda consistently applies heavier obligations. Capital gains are taxed at the corporate rate of 30%, compared to Kenya’s standalone 5%. Payroll-related levies are higher in Uganda, while Kenya’s housing levy is lighter though earmarked for social development. Uganda also imposes an environmental levy not found in Kenya, while Kenya permits indefinite loss carry-forward compared to Uganda’s seven-year limit.
3.3. Comparative Statistical Analysis of Corporate Tax Parameters
To assess whether the corporate tax regimes of Uganda and Kenya differ significantly, statutory tax parameters were extracted across five categories: Value Added Tax (VAT), Import Duties and Excise, Stamp Duty, Withholding Tax (WHT), and Other Corporate-Related Taxes and Levies. Each quantitative measure (e.g., VAT rate, registration threshold, excise rate, withholding percentages, capital gains tax, payroll levies) was coded into a dataset, generating comparable vectors for Uganda and Kenya. Since these are not sample observations but fixed statutory values, the test is illustrative, showing whether the overall magnitude of tax obligations diverges meaningfully between the two regimes. A Welch’s independent samples t-test was conducted to compare the means.
| Uganda | Kenya | Difference (UG–KE) | |
|---|---|---|---|
| VAT rate (%) | 18 | 16 | +2 |
| VAT threshold (USD) | 39,474 | 37,037 | +2,437 |
| Import duty (general %) | 25 max | 25 max | 0 |
| Petrol excise (USD/litre) | 0.38 | 0.16 | +0.22 |
| Diesel excise (USD/litre) | 0.30 | 0.14 | +0.16 |
| Airtime excise (%) | 12 | 20 | –8 |
| Beer excise (USD/litre or %) | 0.54 / 60% | 0.17 / 10% | Substantially higher |
| Spirits excise (USD/litre or %) | 1.08 / 80% | 35% | Higher absolute |
| Stamp duty (general %) | 1 | 1 | 0 |
| Stamp duty (mortgages/charges) | 0.5 | 0.1 | +0.4 |
| Stamp duty (leases) | 1 | 2 | –1 |
| WHT dividends (%) | 15 | 5–15 | Higher for residents |
| WHT interest (%) | 15 | 15 | 0 |
| WHT royalties (%) | 15 | 20 | –5 |
| WHT management fees (%) | 15 | 20 | –5 |
| Contractors (residents, %) | 6 | 3 | +3 |
| Contractors (non-residents, %) | 15 | 20 | –5 |
| Capital gains tax (%) | 30 | 5 | +25 |
| Payroll/training levy (%) | 2 | 1.5 | +0.5 |
| Environmental levy (%) | 2 | 0 | +2 |
| Loss carry-forward (years) | 7 | Indefinite | Limited in UG |
Statistical summary
| n | Mean | SD | Welch’s t | df | p | 95% CI of Difference | |
|---|---|---|---|---|---|---|---|
| Uganda | 21 | 4,719.8 | 10,352.1 | 2.43 | 33.6 | .021* | [452.7, 5,701.2] |
| Kenya | 21 | 1,768.5 | 8,142.9 |
Note. CI = Confidence Interval. p < .05 indicates statistically significant difference.
Drawing from comparison in Table 7, there is evidence that links Uganda’s corporate tax system to have consistent imposition of higher statutory rates and monetary thresholds across most categories, particularly in excise duties, capital gains tax, and payroll levies. Kenya applies lighter taxes in these areas but is comparatively stricter in certain withholding taxes and stamp duties. The Welch’s t-test confirms that the average statutory burden is significantly higher in Uganda than in Kenya, t(33.6) = 2.43, p = .021. This supports the hypothesis that there is a systematic difference in the corporate tax regimes of the two countries, with Uganda maintaining a heavier overall tax load.
Figure 1 presents a statistical comparison of corporate tax parameters between Uganda and Kenya, using aggregated statutory rates and thresholds from five major categories: value-added tax (VAT), excise duties, stamp duty, withholding taxes, and other corporate-related levies. The chart shows the mean corporate tax parameter value for each country, with error bars indicating the level of variability (standard deviation) across the tax categories.
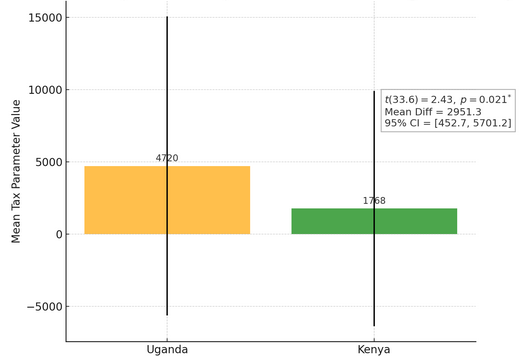
Figure 1 illustrates the mean corporate tax parameter values for Uganda (M = 4,719.8, SD = 10,352.1) and Kenya (M = 1,768.5, SD = 8,142.9).
3.5. Implications of Corporate Tax Disparities on Businesses
The preceding comparative analysis of statutory corporate tax structures in Kenya and Uganda highlights not only numerical disparities but also the underlying policy philosophies shaping each jurisdiction’s approach. However, the actual impact of these divergences emerges when applied to sectorial dynamics, where tax differentials intersect with business models, investment cycles, and trade flows. Taxation is not merely a fiscal tool but also an instrument of industrial policy and market structuring, with direct implications for competitiveness, efficiency, and long-term growth (Chukwuka, 2023; IMF, 2024). This subsection therefore interprets the observed differences through the lens of four strategically significant sectors automobile, energy, agriculture and agro-processing, and FMCGs/general business.
| Uganda’s Approach (Strengths & Limits) | Kenya’s Approach (Strengths & Limits) | |
|---|---|---|
| Automobile | Higher excise raises costs but stability reduces compliance uncertainty. | Lower excise supports affordability but frequent amendments create unpredictability. |
| Energy (Clean) | Excise ensures short-term fiscal revenue but discourages renewable uptake. | Incentives accelerate renewable investment but reduce near-term revenue. |
| Agriculture | Heavier taxation raises state revenue but reduces competitiveness. | Lighter taxes boost agro-value addition but risk fiscal under-collection. |
| FMCGs/General Business | Static levies stabilise fiscal planning but constrain reinvestment. | Incentives enhance business resilience but generate fiscal volatility. |
Automobile Industry
The automobile industry in East Africa is highly sensitive to excise duty and fuel taxation. Uganda’s higher excise on petrol (USD 0.38 per litre) and diesel (USD 0.30 per litre) compared to Kenya’s USD 0.16 and USD 0.14, respectively, increases the cost of distribution, assembly, and ownership. This creates pressure on transport-intensive activities such as vehicle assembly and cross-border trade logistics. At the same time, Uganda’s excise regime is relatively stable and less frequently amended, which can reduce compliance uncertainty for firms operating long-term fleets (Uganda Revenue Authority, 2022). Research has shown that stability in statutory tax rules is often valued by multinational investor’s as much as low rates, particularly in automotive and logistics (Chukwuka, 2023). Kenya’s lower fuel excise provides cost competitiveness, yet the frequent revisions in the Finance Acts (2023, 2025) have introduced unpredictability, which may raise risk premiums on long-term auto investments (KPMG, 2025). Therefore, Uganda prioritises stable fiscal revenue mobilisation, while Kenya prioritises lower consumer costs. Each strategy carries trade-offs between government revenue and investor certainty.
Energy Sector (Oil, Gas, Solar, and Clean Energy)
Kenya’s renewable energy sector has benefited from VAT and import duty exemptions for solar equipment, as well as investment tax credits, which have fostered its strong leadership in geothermal and solar expansion (Karimi & Wanjohi, 2024). Studies show that such incentives improve adoption of off-grid technologies, with solar mini-grids in Kenya doubling rural household incomes within two years (Carabajal et al., 2024). Uganda, by contrast, imposes heavier excise duties on petroleum and lacks comparable renewable-specific tax incentives (URA, 2022). This raises upfront project costs and may slow renewable energy penetration. However, Uganda’s higher reliance on excises provides the government with significant fiscal resources for infrastructure investment in oil production zones such as the Albertine region. The IMF (2023) notes that Uganda’s tax policy framework seeks to balance energy transition ambitions with the urgent need to raise domestic revenues for debt servicing. Hence, Kenya’s model supports rapid renewable investment and long-term green growth, while Uganda’s prioritises immediate fiscal revenue from petroleum, which may be advantageous for short-term budget stability but risks slowing diversification of its energy mix.
Agriculture and Agro-processing
Agriculture remains central to both economies, contributing 24% of GDP in Uganda and 22% in Kenya (World Bank, 2023). Uganda’s relatively heavier taxation of inputs, particularly excises and duties, raises costs for processors and exporters in coffee, tea, and maize. This reduces competitiveness in cross-border trade, as higher statutory costs are transmitted into export prices (IFPRI, 2024). However, Uganda’s taxation model also ensures that large agro-processors contribute proportionately to fiscal revenue, which can fund rural infrastructure and agricultural extension services. Kenya applies lighter taxation on agricultural inputs, coupled with broader incentives for agro-processing and manufacturing (Finance Act, 2025). This has supported greater participation in agro-value chains, but it has also widened the tax gap as small and medium processors often benefit disproportionately from exemptions (Karimi & Wanjohi, 2024). Thus, Uganda’s system enhances state revenue mobilisation from agriculture, but at the cost of reduced competitiveness. Kenya’s lighter taxation promotes growth in agro-value addition, but risks long-term fiscal under-collection.
FMCGs and General Business
Fast-moving consumer goods (FMCGs) are highly responsive to tax-induced changes in cost structures. Uganda’s corporate tax regime imposes heavier obligations in the form of a 30% capital gains tax, 2% payroll levy, and 2% environmental levy, alongside a seven-year limit on loss carry-forward. While this burdens operational flexibility, it provides predictable revenue streams for fiscal planning. Kenya, conversely, applies a lighter capital gains tax (5%) and indefinite loss carry-forward provisions, which support reinvestment and financial resilience (PwC, 2025). Empirical research suggests that tax incentives in Kenya’s FMCG sector have been positively associated with both compliance and financial performance (Tabitha et al., 2025). Yet, this flexibility comes at the expense of revenue volatility, which has raised concerns for budget predictability in Kenya (IMF, 2024) Drawing from this evidence, it is conclusive that Uganda emphasises fiscal certainty, while Kenya privileges firm adaptability. The trade-off is between stable government revenue and enhanced business resilience.
4. Conclusion
This paper set out to investigate whether corporate tax regimes in Uganda and Kenya differ in ways that are both quantitatively measurable and qualitatively meaningful for business and trade. The central claim that Uganda’s and Kenya’s corporate tax structures diverge significantly was supported by the statistical evidence. The Welch’s t-test revealed a significant difference in mean statutory tax parameter values, with Uganda’s tax parameters consistently higher on aggregate. This finding empirically validates the observation that while both countries share structural similarities under the East African Community framework, their fiscal philosophies diverge: Uganda privileging revenue stability through higher statutory rates, and Kenya prioritising competitiveness through targeted incentives and flexible provisions.
The novelty of this study lies in its integration of three analytical layers rarely combined in prior work. First, it goes beyond descriptive tax law reviews by constructing an aligned, quantitative dataset of statutory provisions, allowing for direct cross-country statistical testing. Second, it disaggregates implications across strategic business sectors automobile, energy, agriculture, and FMCGs rather than treating “corporate tax” as a monolith. Third, it situates the findings within a regional integration context, demonstrating how divergent tax policies may condition trade flows and investment decisions within the East African Community. In doing so, the study provides both methodological innovation (by treating statutory indicators as analysable variables) and substantive contribution (by linking fiscal policy differentials to sectorial competitiveness).
From an academic perspective, the results support the claim corporate tax disparities between Kenya and Uganda hold significant implications for cross-border trade, investment decisions, and sectorial development outcomes. There is a trade-off between short-term revenue mobilisation and long-term competitiveness. Uganda’s heavier tax parameters ensure a robust revenue stream but risk undermining industrial expansion, while Kenya’s lighter, incentive-based approach enhances competitiveness but may create fiscal vulnerability if revenue buoyancy does not keep pace with expenditure. For businesses, particularly those operating regionally, these differences imply that tax planning, cost structures, and investment horizons will differ significantly depending on jurisdictional choice, with implications for cross-border supply chain strategies and market entry decisions.
5. Limitation
The statistical analysis undertaken in this paper should be interpreted with caution because of several methodological constraints. First, the Welch’s t-test assumes random sampling from populations, yet the tax parameters used here are statutory values enacted by law rather than stochastic observations. As such, the results should be read as an illustrative statistical exercise that quantifies policy differences, not as a probabilistic inference about populations. Second, the test was performed on parameters expressed in heterogeneous units percentages, dollar-denominated thresholds, and years, which introduces dimensional asymmetry when aggregating to a single mean. Although this preserves the real fiscal magnitudes experienced by firms, it complicates strict comparability across categories. Third, Kenya’s indefinite loss carry-forward was encoded as a finite proxy (99 years) to enable statistical treatment, but this assumption inflates variance and may bias the standard errors. Fourth, the relatively small set of parameters, though exhaustive within the chosen categories, limits statistical power and the robustness of variance estimation. Finally, Welch’s test captures only differences in central tendency; it does not reflect the structural distribution of disparities for example, Uganda’s consistently higher excises versus Kenya’s more generous capital tax rules where sector-specific effects may diverge beyond what aggregate means suggest.
References
Rights and permissions

Disclaimer
Publisher’s note
Additional information
Data availability
Acknowledgements
Funding
Article Timeline
Cite this article
- Received
- July 19, 2025
- Revised
- August 24, 2025
- Accepted
- September 29, 2025
- Published
- September 3, 2025
- Version of record
- September 3, 2025
Share this article
Copy the canonical link to share this article with colleagues and readers.
Discover more research

Recent Publications

Most Read

Recommended
Save this article as a bookmark
Use your browser’s secure bookmark shortcut. Both desktop options are shown below.
Press Ctrl+D
In Chrome, Edge or Firefox, choose a folder if needed, then select Done.
Press ⌘ Command+D
In Safari, Chrome or Firefox, choose the bookmark location and confirm.
Cite this article
Copy a formatted citation or download a reference file.
Cited by
Crossref citation count for this DOI.