

The effects of administrative efficiency on university students’ satisfaction among state universities in Zimbabwe

Abstract
This study investigates the impact of administrative efficiency, specifically timeliness and communication, on student satisfaction among public universities in Zimbabwe. Using a structured questionnaire, data were collected from 246 university students across one state university. Descriptive analysis revealed that perceptions of administrative timeliness were consistently positive (M = 3.73 to 3.84), while communication dimensions showed greater variability (M = 2.22 to 3.92). Pearson correlation analyses demonstrated significant positive relationships between both timeliness (r = .471, p < .001) and communication (r = .383, p < .001) and overall student satisfaction. Multiple linear regression analysis further confirmed that combined administrative timeliness and communication significantly predicted student satisfaction (F (2, 243) = 48.46, p < .001), accounting for 28.5% of the variance (R² = .285, adjusted R² = .279). Individually, timeliness (B = 0.500, β = .411, p < .001) exerted a more substantial influence than communication (B = 0.401, β = .302, p < .001). These findings emphasize the importance for higher education policymakers and administrators in Zimbabwe to enhance service delivery speed and communication clarity to improve student satisfaction levels. The study contributes to understanding administrative determinants of student satisfaction within the context of Zimbabwean public universities and provides practical understandings for institutional improvement.
Introduction
University administrative offices serve as critical interfaces between students and universities by facilitating registration, academic records, examinations, fee administration, and access to institutional information. Consequently, delays, inconsistent responses, inaccurate information, or unclear administrative procedures may disrupt students’ academic progress and undermine their confidence in institutional processes. Although administrative service quality and student satisfaction have received considerable attention in international higher education research, empirical evidence from state universities in Zimbabwe remains relatively limited and context-specific. Existing Zimbabwean studies indicate that students’ evaluations of service quality may vary across faculties and levels of study, while the availability and quality of digital information and support services can also influence students’ perceptions and evaluations of university services (Dangaiso & Makudza, 2022; Moyo & Ngwenya, 2018). Against this background, the present study examines the effect of administrative efficiency on student satisfaction within the context of Zimbabwean state universities. In this study, administrative efficiency is conceptualized as the dependable, timely, accurate, accessible, and responsive delivery of university administrative services. This conceptualization is consistent with the SERVQUAL framework, which identifies reliability, responsiveness, assurance, empathy, and tangibles as important dimensions of perceived service quality (Parasuraman et al., 1985, 1988).
Previous applications of service-quality models in higher education demonstrate that students’ evaluations can differ across specific service attributes and institutional contexts, suggesting that administrative performance should be examined through distinct dimensions rather than assumed to be uniformly effective (Douglas et al., 2006; Rizos et al., 2022; Soares et al., 2017). In addition, Expectancy-Disconfirmation Theory provides a complementary explanation of student satisfaction by proposing that satisfaction results from the comparison between prior expectations and perceived service performance (Oliver, 1980). The integration of SERVQUAL and Expectancy-Disconfirmation Theory therefore provides a useful theoretical basis for examining whether efficient administrative service delivery contributes to higher levels of student satisfaction.
Accordingly, the study sought to assess students’ perceptions of the timeliness of administrative services, examine students’ perceptions of administrative communication, and determine whether administrative-efficiency indicators are significantly associated with and collectively predict student satisfaction. The first two objectives are addressed using descriptive statistics, while the third is examined through correlation analysis and multiple regressions to establish both the strength of associations and the predictive contribution of administrative-efficiency dimensions to students’ satisfaction.
Literature Review
Administrative Timeliness and Student Satisfaction
A substantial body of research links the promptness of administrative service delivery to student satisfaction. Shah and Nair (2021) reported that the timely handling of administrative tasks reduces student frustration and enhances trust in institutional processes. Similarly, Mutanga (2020) found that timely registration, prompt processing of academic records, and efficient communication procedures significantly increase students' perceptions of institutional effectiveness. Osman and Saputra (2019) further established that prompt service delivery is a strong predictor of student loyalty in universities, while Douglas and Douglas (2006) demonstrated that delays in administrative procedures negatively affect students' overall educational experience. More broadly, reliability and responsiveness have been identified as important, though context-dependent, dimensions of administrative service quality (Moyo& Ngwenya, 2018; Rizos et al., 2022).
Administrative Communication and Student Satisfaction
Communication-related attributes of administrative service have similarly been linked to student evaluations of institutional quality. Prior research suggests that administrative attributes such as the clarity of information, the timeliness of announcements, and staff courtesy may be evaluated quite differently by students even within the same institution, pointing to the value of treating communication as a multidimensional construct rather than a single uniform experience (Douglas et al., 2006; Soares et al., 2017). This pattern is consistent with the present sample, in which the clarity and accuracy of departmental information was rated distinctly differently from the timeliness of announcements and the courteousness of staff responses.
Methodological Considerations in Measuring Satisfaction
A recurring caution in this literature is the importance of treating student satisfaction as a distinct, validated construct rather than inferring it from service-attribute items alone. Al-Kilani and Twaissi (2017) and Seitova et al. (2024) both emphasize that service-quality attributes and the satisfaction construct should be measured separately, using validated instruments, before their relationship is estimated statistically. The present study incorporates this recommendation directly: overall student satisfaction was measured as a distinct composite variable, separate from the timeliness and communication items, allowing the predictive relationships examined here to be interpreted with more confidence than would be possible from item-to-item correlations alone.
Theoretical Framework
SERVQUAL guided the selection and interpretation of administrative-service attributes particularly reliability and responsiveness (Parasuraman et al., 1988). Expectancy-disconfirmation theory explains satisfaction as an evaluation of whether perceived performance meets or departs from prior expectations (Oliver, 1980). These frameworks are complementary: SERVQUAL identifies service-quality dimensions, whereas expectancy-disconfirmation explains how service experiences may contribute to satisfaction. Similar higher-education studies have treated service quality and satisfaction as related but distinct constructs that require separate, validated measurement (Al-Kilani & Twaissi, 2017; Bwachele et al., 2023; Seitova et al., 2024).
Conceptual Framework
The conceptual framework positions student satisfaction as the dependent variable and administrative efficiency as the independent variable, represented by timeliness, administrative communication, service accessibility, information accuracy, and staff responsiveness. The hypothesised direction is positive: improved performance on each administrative dimension is expected to correspond with higher student satisfaction. The empirical relationship is:
SSᵢ = β₀ + β₁TEᵢ + β₂ACᵢ + β₃ASᵢ + β₄AIᵢ + β₅RSᵢ + εᵢ
Here, SS denotes student satisfaction; TE denotes timeliness; AC denotes administrative communication; AS denotes accessibility; AI denotes information accuracy; RS denotes responsiveness; β₀ represents the intercept; β₁–β₅ represent the regression coefficients; and ε represents the error term. The expected signs of the regression coefficients are β₁–β₅ > 0, indicating that each administrative-efficiency dimension is expected to have a positive relationship with student satisfaction. Figure 1 presents the conceptual framework schematically, illustrating the hypothesized paths from each administrative-efficiency dimension to student satisfaction.
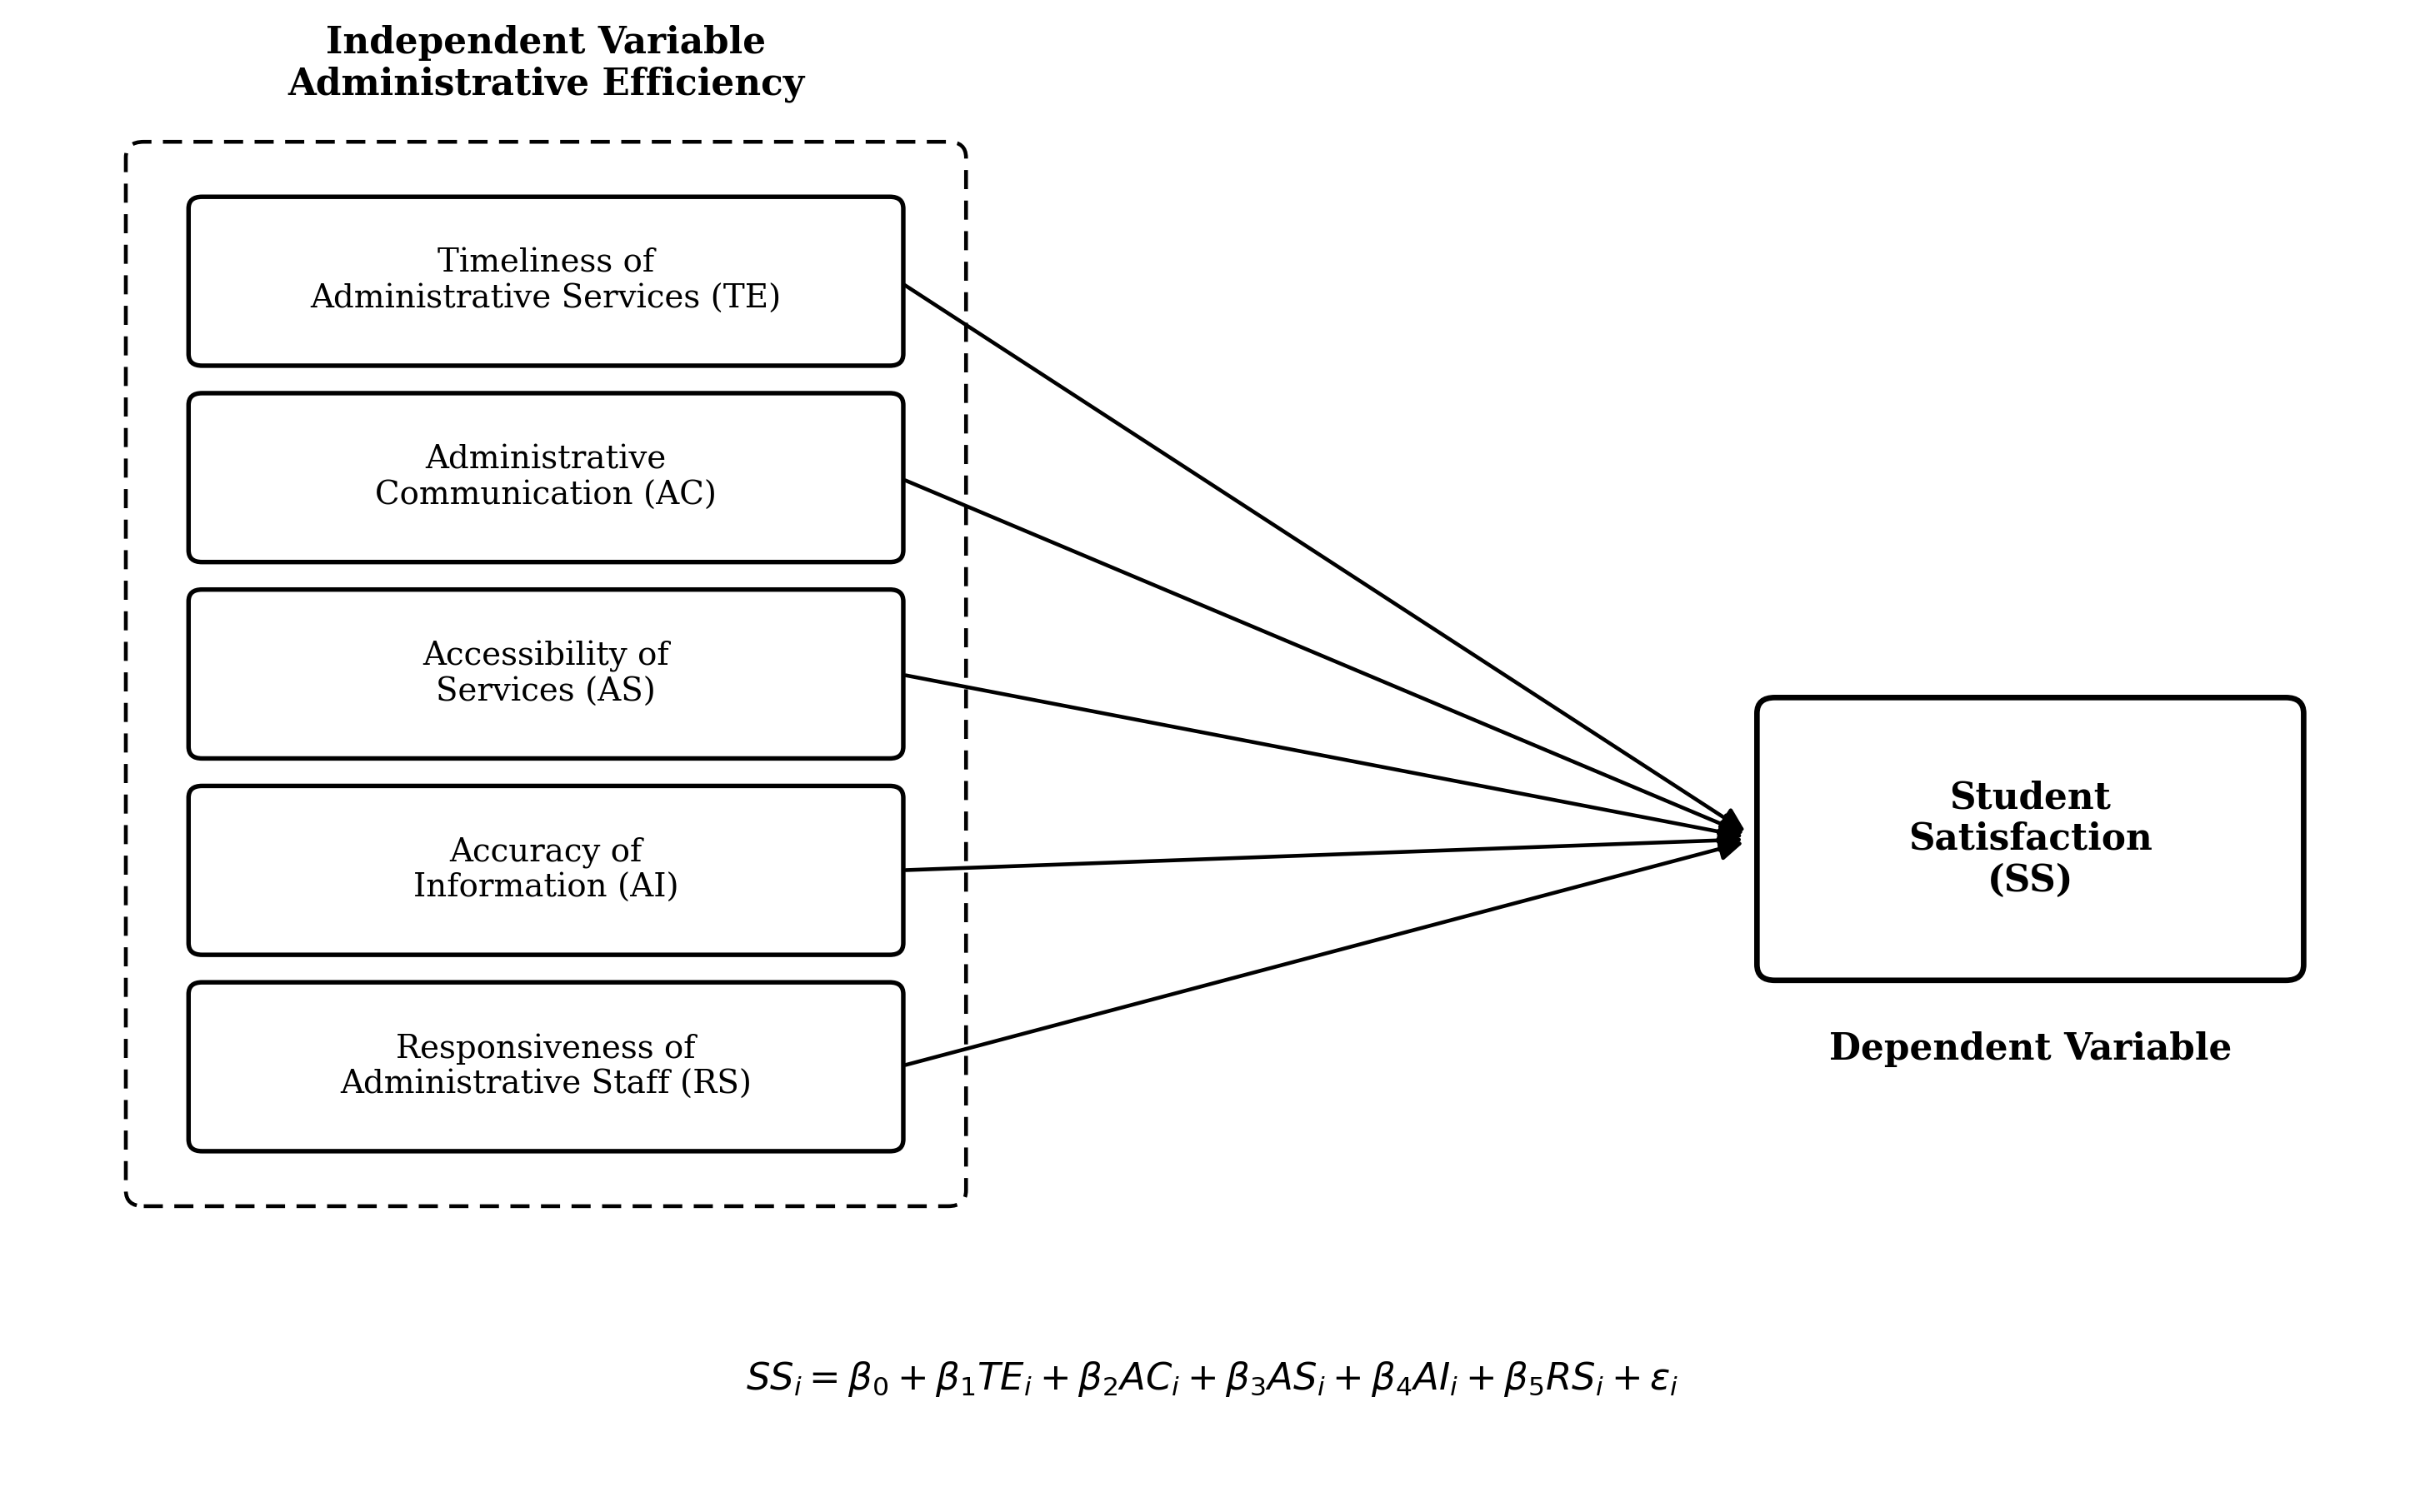
Note. TE = timeliness of administrative services; AC = administrative communication; AS = accessibility of services; AI = accuracy of information; RS = responsiveness of administrative staff; SS = student satisfaction. Arrows show the hypothesised direction of each relationship (β₁–β₅ > 0) specified in the empirical model above.
These relationships depict the a priori conceptual model and are not confirmed statistical effects, because the results reported in this study do not yet include a validated correlation or regression coefficient between the administrative-efficiency dimensions and student satisfaction (see Results and Discussion).
Methodology
Research Design
The study adopted a positivist research philosophy and a quantitative, cross-sectional research design. The study was conducted at one state university in Zimbabwe to examine the relationship between administrative efficiency and student satisfaction. Data were collected at a single point in time using a structured, closed-ended questionnaire administered to students selected from five faculties. The cross-sectional design was appropriate because it enabled the study to measure students’ perceptions of administrative-efficiency dimensions and their level of satisfaction and to statistically examine the relationships between these variables.
Population
The target population comprised the approximately 2,500 students enrolled across the five faculties of the participating state universities (Midlands State University, Great Zimbabwe University, University of Zimbabwe, Bindura University of Science Education and Chinhoyi University of Technology) during the data-collection period. This population defines the students who could, in principle, evaluate the administrative services under investigation (registration, records, examinations, and related student-facing processes) and therefore represents the frame from which respondents were drawn.
Respondents were recruited on an on-site, in-person basis. The researcher approached students at their respective faculties during the data-collection period, explained the purpose, voluntary nature, and confidentiality safeguards of the study, and invited currently enrolled students who were able to comment on their experience of administrative services to complete the questionnaire immediately. Because respondents were those who were present, accessible, and willing to participate at the time and place of distribution, this procedure is best described as convenience/purposive recruitment rather than random selection from a formal sampling frame such as a full student register.
Sample and Sampling Procedure
Sample size was set using a fixed-proportion rule of the kind commonly applied in survey research when a formal margin-of-error calculation is not undertaken: n = p × N, where n is the sample size, p is the selected proportion of the population, and N is the population size. Applying p = .10 (10%) to N = 2,500 gives n = .10 × 2,500 = 250, the figure the researcher used; 250 questionnaires were distributed across the five faculties, and 246 were returned complete and valid, a response rate of (246 ÷ 250) × 100 = 98.4%.
| University | Total Number | Proportion | Sample |
|---|---|---|---|
| University of Zimbabwe | 600 | 24% | 60 |
| Midlands State University | 400 | 16% | 40 |
| Great Zimbabwe University | 500 | 20% | 50 |
| Chinhoyi University of Technology | 600 | 24% | 60 |
| Bindura University of Science Education | 400 | 16% | 40 |
| Total | 2,500 | 100% | 250 |
For additional context, a finite-population formula such as Yamane’s (1967)n = N / [1 + N(e)²] can be used to translate an achieved sample size back into an implied margin of error, e. At N = 2,500, a sample of 250 corresponds to e. 06 (a 6% margin of error), lower than the 5% margin conventionally used in social-science survey research, which would require n ≈ = 345 at the same population size. This comparison is offered as an additional limitation of the achieved sample rather than as the procedure the researcher originally applied.
Data Collection Instrument and Procedure
Data were collected using a physical, paper-based questionnaire; no online or electronic distribution channel (for example, an emailed link or a web-based survey platform) was used at any stage of data collection. The instrument contained closed-ended, Likert-type items covering administrative timeliness, communication, responsiveness, accessibility, information accuracy, and student satisfaction.
Administration was interviewer-assisted and on-site. The researcher personally handed the questionnaire to each respondent at their faculty location, explained the completion procedure, remained available to clarify items while respondents completed the questionnaire, and collected each completed questionnaire directly rather than through a drop-box or postal return. Every returned questionnaire was checked for completeness on the spot before being securely stored for data entry and analysis.
The response anchors, coding direction, exact data-collection dates, and any pretest or validation procedure were not documented, and no reliability statistic (for example, Cronbach’s alpha) was reported for the multi-item constructs. Without these details, the item means reported in the Results section can be compared with one another numerically, but they cannot yet be translated into agreement or disagreement categories, and the internal consistency of the multi-item scales cannot be confirmed.
Data Analysis
SPSS was used to analyse the data. Descriptive statistics were reported first as means and standard deviations, followed by two-tailed Pearson correlations evaluated at α = .05. The specified empirical model requires multiple regressions to estimate the unique contribution of each administrative-efficiency dimension to student satisfaction. A defensible regression report should include the Model Summary, ANOVA, and Coefficients tables and should document checks of linearity, normality of residuals, homoscedasticity, independence, multicollinearity, and influential cases. Those outputs were not available for the present analysis.
Results and Discussion
Descriptive Analysis Findings
Of the 250 questionnaires distributed, 246 were valid for analysis, yielding a 98.4% response rate. Descriptive findings are presented in Table 2 and Table 3 before inferential statistics. This is because the questionnaire anchors and coding direction were not documented, the results are interpreted as relative numerical patterns rather than as agreement or disagreement categories.
| Item | M | SD |
|---|---|---|
| Administrative offices process student requests within a reasonable time | 3.73 | 0.601 |
| I receive timely updates and responses to my administrative inquiries | 3.77 | 0.617 |
| Delays in administrative services rarely affect my academic progress | 3.84 | 0.545 |
Note. N = 246. M = mean; SD = standard deviation. The questionnaire’s response anchors and coding direction were not reported.
Timeliness means ranged narrowly from 3.73 to 3.84, with an unweighted average of the three item means of 3.78. Standard deviations ranged from 0.545 to 0.617, indicating comparatively limited dispersion around each item mean. The highest mean concerned delays rarely affecting academic progress, while the lowest concerned processing requests within a reasonable time. Because scale direction is unknown, the higher mean cannot be labelled favourable or unfavourable. The close clustering nevertheless suggests that the three timeliness experiences were rated similarly. This item-level pattern is consistent with research showing that reliability and responsiveness are important but context-dependent aspects of administrative service quality (Moyo & Ngwenya, 2018; Rizos et al., 2022).
| Item | M | SD |
|---|---|---|
| Information from administrative departments is clear, accurate, and easy to understand | 3.92 | 0.394 |
| The university communicates important announcements in a timely manner | 2.22 | 0.596 |
| Administrative staff provide helpful and courteous responses to questions and concerns | 2.30 | 0.718 |
Note. N = 246. M = mean; SD = standard deviation. The average of item means (2.81) is descriptive and is not a validated composite score.
Communication means varied from 2.22 to 3.92, with an unweight average of 2.81. The 1.70-point range shows that students did not rate all communication attributes similarly. Information clarity and accuracy had the highest mean and the smallest standard deviation (M = 3.92, SD = 0.394); timely announcements and helpful, courteous responses had lower means of 2.22 and 2.30. Although the coding direction prevents evaluative labels, the variation identifies separate processes that administrators should investigate rather than treating communication as a single uniform experience. This interpretation accords with service-quality studies showing that administrative attributes may produce different evaluations and therefore require dimension-specific improvement (Douglas et al., 2006; Soares et al., 2017).Table 4 presents the means, standard deviations, and Pearson correlations among the timeliness composite, communication composite, and overall student satisfaction.
| Variable | M | SD | 1 | 2 | 3 |
|---|---|---|---|---|---|
| 1. Timeliness score | 3.78 | 0.43 | — | .198** | .471*** |
| 2. Communication score | 2.81 | 0.43 | .198** | — | .383*** |
| 3. Overall student satisfaction (Y) | 3.78 | 0.52 | .471*** | .383*** | — |
Note. N = 246. M and SD represent mean and standard deviation, respectively. Composite scores represent the unweighted average of their three constituent 5-point Likert items. **p < .01. ***p < .001.
Both administrative dimensions were significantly and positively correlated with overall student satisfaction. Timeliness showed a moderate positive association with satisfaction, r = .471, p < .001, and communication showed a somewhat weaker, though still moderate, positive association with satisfaction, r = .383, p < .001. The two predictors were only modestly correlated with each other, r = .198, p < .01, indicating that they capture largely distinct aspects of students' administrative experience rather than redundant information. This pattern supported proceeding to a multiple regression model in which both dimensions were entered simultaneously.
This restrained interpretation is consistent with higher-education research that separates service attributes from the satisfaction construct and uses validated measures before estimating their relationship (Al-Kilani&Twaissi, 2017; Seitova et al., 2024).
Delay-related disruption and information clarity were positively but very weakly associated, r(244) = .090, p = .158. Because p> .05, the null hypothesis of no linear association was not rejected. The coefficient must therefore not be reported as r = .90, as very strong, or as meaningful despite nonsignificance. The result provides insufficient evidence of an association between these two items in the sample. It also does not test administrative communication against student satisfaction because the second variable is information clarity, not the dependent satisfaction measure. Thus, a follow-up regression analysis was completed as shown in Table 4.
Prior to evaluating the regression model, preliminary assumption testing was performed. Visual inspection of residual scatterplots confirmed bivariate linearity and homoscedasticity between each predictor and the outcome. Normal probability plots (P-P plots) of the regression residuals indicated that residuals were approximately normally distributed. Multicollinearity was not a concern, as variance inflation factors (VIFs) for both predictors were well below the standard cutoff threshold (VIF = 1.04), consistent with the modest zero-order correlation between the two predictors reported above.A standard multiple linear regression was conducted to test whether administrative timeliness and communication significantly predicted overall student satisfaction.The empirical sample regression equation was:
Ŷ = 0.769 + 0.500(X_Timeliness) + 0.401(X_Communication)
| Model | R | R² | Adjusted R² | SE of the Estimate |
|---|---|---|---|---|
| 1 | .534 | .285 | .279 | 0.442 |
Note. Predictors: (Constant), Timeliness Composite, Communication Composite.
| Source | SS | df | MS | F | p |
|---|---|---|---|---|---|
| Regression | 18.881 | 2 | 9.440 | 48.46 | < .001 |
| Residual | 47.367 | 243 | 0.195 | ||
| Total | 66.248 | 245 |
Note. Dependent variable: Overall Student Satisfaction. Sum-of-squares values were derived from the reported R², N, and SD of the satisfaction composite (SS_Total = (N − 1) × SD²; SS_Regression = R² × SS_Total); minor rounding discrepancy from the exact SPSS output is possible because the satisfaction SD was reported to two decimal places. Author should substitute exact SPSS sum-of-squares values if available.
| Predictor | B | 95% CI [LL, UL] | SE B | β | t | p |
|---|---|---|---|---|---|---|
| (Intercept) | 0.769 | [0.172, 1.366] | 0.303 | — | 2.538 | .012 |
| Timeliness composite | 0.500 | [0.369, 0.630] | 0.066 | .411 | 7.542 | < .001 |
| Communication composite | 0.401 | [0.259, 0.544] | 0.072 | .302 | 5.545 | < .001 |
Note. CI = confidence interval; LL = lower limit; UL = upper limit. B = unstandardized regression coefficient; SE B = standard error of B; β = standardized regression coefficient.
The overall regression model was statistically significant, F(2, 243) = 48.46, p < .001, and accounted for 28.5% of the variance in overall student satisfaction (R² = .285, adjusted R² = .279), with a standard error of the estimate of 0.442. The ANOVA decomposition indicated that the regression sum of squares (18.881) was substantially smaller than the residual sum of squares (47.367), consistent with a model of moderate rather than large explanatory strength: approximately 71.5% of the variance in satisfaction remained unexplained by the two predictors in this model.
Both administrative dimensions emerged as positive and statistically significant unique predictors of student satisfaction. Timeliness was the stronger predictor, B = 0.500, 95% CI [0.369, 0.630], β = .411, t(243) = 7.542, p < .001: holding communication constant, each one-unit increase in perceived administrative timeliness was associated with a 0.500-unit increase in overall student satisfaction. Communication quality also uniquely and positively predicted student satisfaction, B = 0.401, 95% CI [0.259, 0.544], β = .302, t(243) = 5.545, p < .001. Comparison of the standardized coefficients indicates that timeliness (β = .411) exercised a somewhat stronger relative influence on student satisfaction than administrative communication (β = .302), though both remained significant predictors net of one another. On this basis, the null hypotheses H01, H02, and H03 were all rejected.
The findings indicate that administrative timeliness and administrative communication each make a significant, independent contribution to overall student satisfaction, and that together they account for a meaningful, though partial, share of the variance in satisfaction. These results are broadly consistent with prior research linking prompt administrative service delivery to reduced student frustration and increased institutional trust (Shah & Nair, 2021), improved perceptions of institutional effectiveness (Mutanga, 2020), and greater student loyalty (Osman & Saputra, 2019), as well as with evidence that administrative delays detract from students' overall educational experience (Douglas & Douglas, 2006).
The finding that communication also independently predicted satisfaction, with a somewhat smaller but still substantial effect, extends this literature by demonstrating that communication quality is not merely a secondary or redundant contributor to timeliness but an independently influential dimension of the administrative experience (Douglas et al., 2006; Soares et al., 2017). The modest correlation observed between the timeliness and communication composites (r = .198) supports this interpretation: the two dimensions appear to capture distinguishable aspects of students' administrative experience rather than a single underlying factor.
The relative strength of timeliness (β = .411) compared with communication (β = .302) suggests that, when administrators must prioritize limited improvement resources, interventions targeting the speed and predictability of service delivery may yield somewhat larger gains in satisfaction than communication-focused interventions alone though the latter remain independently worthwhile given their own significant unique contribution.
This paper addresses a limitation noted in prior item-level analyses of this dataset, in which no distinct, validated satisfaction measure was available and item-to-item correlations could not be interpreted as effects on satisfaction. By incorporating a separately measured satisfaction composite, consistent with recommendations to keep service-quality attributes and the satisfaction construct analytically distinct (Al-Kilani & Twaissi, 2017; Seitova et al., 2024), the present regression model offers a more direct and interpretable test of the conceptual model than was previously possible.
Conclusion
In this article, a claim was tested to determine whether administrative timeliness and communication jointly and uniquely predict overall student satisfaction. The evidence supports the claim; a multiple regression model containing both dimensions was statistically significant and explained 28.5% of the variance in student satisfaction, with both timeliness and communication contributing unique, significant, positive effects. Timeliness exerted a somewhat larger relative influence than communication, but neither dimension was redundant with the other. At the same time, the majority of the variance in student satisfaction (approximately 71.5%) remains unaccounted for by these two dimensions alone, indicating that administrative efficiency, while an important lever, is not the sole determinant of how satisfied students feel with their institution.
Limitations
This study has several limitations that should be considered when interpreting its findings. First, the cross-sectional design captures students’ perceptions at one point in time and therefore cannot establish the causal direction between administrative-efficiency dimensions and student satisfaction. Second, the sample was drawn from a single institutional context and included 246 respondents (N = 246), which may limit the generalizability of the findings to other universities or educational systems. Third, the use of self-reported data may be affected by common-method bias and social-desirability effects. Fourth, the response anchors and coding direction of the underlying Likert-scale items were not fully documented in the available source materials, which limits the substantive interpretation of absolute mean scores beyond their statistical results. Finally, the regression model included only two predictors, leaving a substantial proportion of the variance in student satisfaction (71.5%) explained by other factors that were not included in the model.
References
Rights and permissions

Disclaimer
All claims expressed in this article are solely those of the author and do not necessarily represent those of the publisher, editors, reviewers, or affiliated institutions. Any product, service, or claim that may be evaluated in this article is not guaranteed or endorsed by the publisher.
Publisher’s note
The publisher remains neutral with regard to jurisdictional claims.
Additional information
Author contributions
Data availability
The data supporting the findings of this study are available from the corresponding author upon reasonable request.
Funding
Ethics declarations
Conflict of interest
Peer review
Article Timeline
 Publication record
Cite this article
- Received
- July 28, 2026
- Revised
- August 20, 2026
- Accepted
- August 28, 2026
- Published
- September 14, 2026
- Version of record
- September 14, 2026
Share this article
Share the article record with colleagues and readers worldwide.
Explore research across our journalsDiscover more research

Recent Publications

Most Read

Recommended
Save this article as a bookmark
Use your browser’s secure bookmark shortcut. Both desktop options are shown below.
Press Ctrl+D
In Chrome, Edge or Firefox, choose a folder if needed, then select Done.
Press ⌘ Command+D
In Safari, Chrome or Firefox, choose the bookmark location and confirm.
Cite this article
Copy a formatted citation or download a reference file.
Cited by
Crossref citation count for this DOI.