

Rainfall variability and land cover change in the Zaaba Watershed and implications for sustainable food security
Abstract
Climate variability and land cover change can affect water availability and agricultural production. This article examined rainfall variability during 1991–2020 and land cover change during 2001–2020 in the Zaaba watershed, Vihiga County, Kenya, and considered their implications for food security. Rainfall trends were assessed using the Mann–Kendall test and a reported trend estimator, while land cover was analysed using Landsat imagery. Socioeconomic information was collected from a sample of 150 respondents using questionnaires, focus group discussions and key informant interviews. The reported trend estimates were negative for the March–May long rains (−0.030) and positive for the October–December short rains (0.136) and annual rainfall (0.503). However, inconsistencies between the reported p-values and Z statistics prevent firm conclusions about statistical significance. The reported agricultural category declined from 50.05% in 2001 to 32.80% in 2020, while built-up land increased from 5.06% to 17.68%. Reported riparian cover declined from 5.18% to 0.87%. Eighty-three per cent of respondents identified mixed farming as the main economic activity. Response denominators and the interpretation of other reported perceptions require clarification. These findings indicate potential pressures on agricultural livelihoods. The article recommends protecting riparian areas and improving local capacity for sustainable land and water management. The reported associations do not establish that land cover change caused changes in rainfall or quantify effects on crop yields or household food security.
Highlights
- ObjectiveNo reliable short passage identified. Please consult the full article. Read full text
- MethodsThe Zaaba watershed forms part of the Yala River catchment in Vihiga County, western Kenya (Figure 1). Read source
- FindingsThe study area experiences the MAM long rains and OND short rains. Read source
- ConclusionThe reported trend estimates were negative for MAM rainfall and positive for OND and annual rainfall during 1991–2020. Read source
About this reading aid
These are complete passages selected automatically from the abstract and full text using section labels and study-specific wording. Selection runs locally on the journal server, without an external AI service. It may miss nuance or select an imperfect passage; it is not an independent assessment or an editor-reviewed summary. Missing points are identified explicitly.
Introduction
Many countries in sub-Saharan Africa depend heavily on rain-fed agriculture. Variability in rainfall amount, timing and distribution can constrain water availability and agricultural production, creating challenges for food security and adaptation (Chouhan et al., 2023; Huho & Mugalavai, 2010). Rainfall also varies across East Africa at seasonal and interannual timescales (Muchiri et al., 2020; Seregina et al., 2019). Large-scale atmospheric and oceanic processes, including the El Niño–Southern Oscillation, the Madden–Julian Oscillation and the Indian Ocean Dipole, contribute to this variability. Berhane and Zaitchik (2014), for example, examine the influence of the Madden–Julian Oscillation on daily precipitation in East Africa. Understanding rainfall variability requires analysis of rainfall totals, seasonal distribution and trends. Studies in other African basins also demonstrate the importance of distinguishing rainfall trends from their hydrological consequences (Kankam-Yeboah et al., 2013; Rustum et al., 2017).
Land cover change can further modify catchment hydrology. Urbanisation, cultivation and changes in vegetation cover can alter interception, infiltration, evapotranspiration and surface runoff (Brouziyne et al., 2018; Kiluva et al., 2022; Odiero et al., 2018). The direction and magnitude of these effects depend on the land cover transition, soil characteristics, management practices and climatic conditions. Conversion of agricultural land to settlement can also reduce the area available for cultivation. Research on agricultural land use in Kenya highlights the need to consider these changes alongside household livelihood and food security conditions (Kumba et al., 2015). The county’s environment policy also identifies degradation of forests and wetlands as a land management concern (County Government of Vihiga, 2019).
This article examined rainfall variability in the Zaaba watershed during 1991–2020 and land cover change during 2001–2020, together with respondents’ perceptions of their implications for water availability and agricultural production. Integrated analysis of land and water resources can inform catchment management and adaptation in areas dependent on rain-fed agriculture (Langat et al., 2019). The article compares temporal patterns and reported perceptions; it does not isolate a causal effect of land cover change on rainfall.
Methods
Study Area
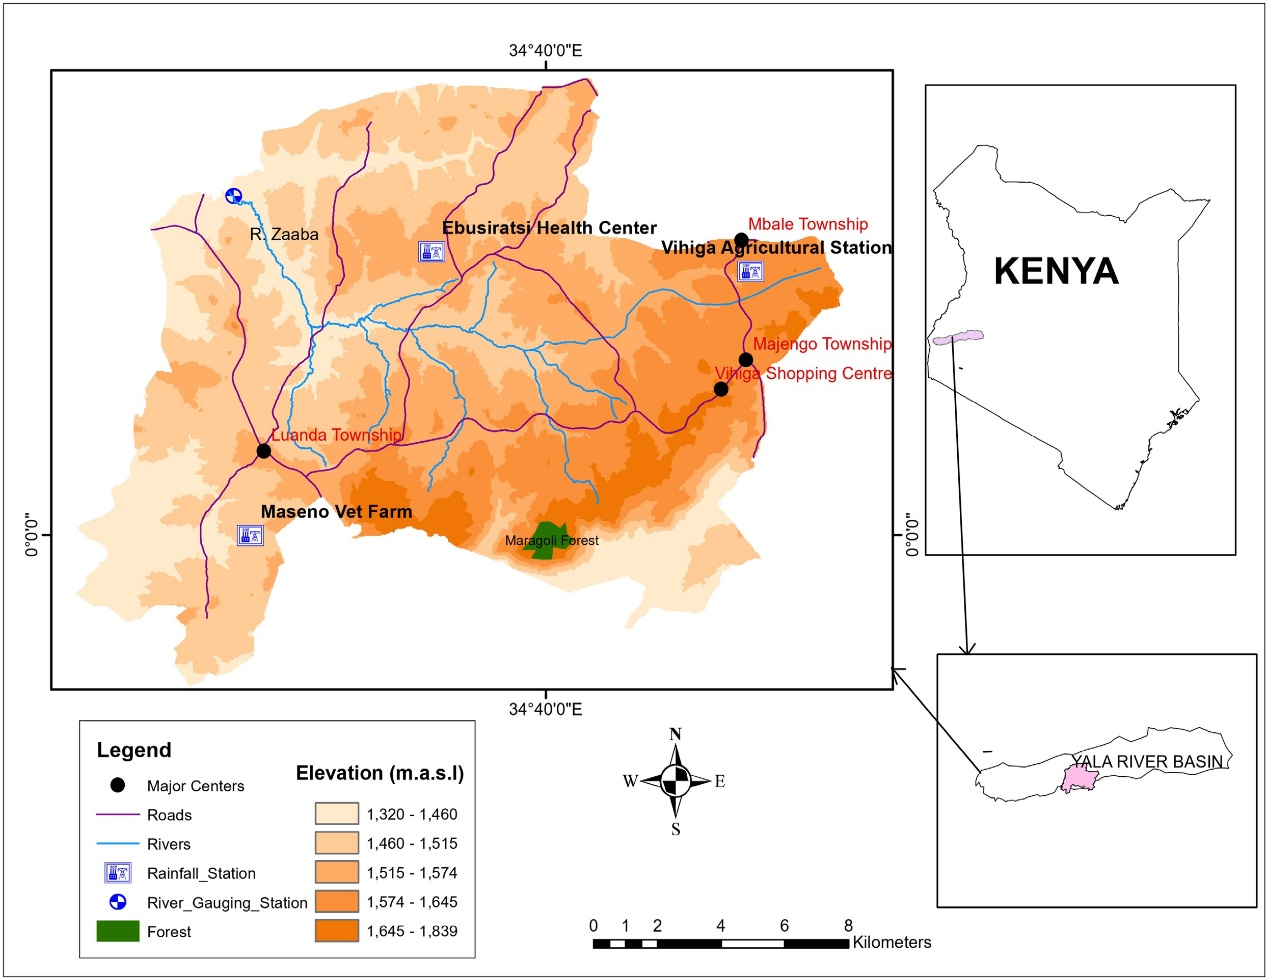
The Zaaba watershed forms part of the Yala River catchment in Vihiga County, western Kenya (Figure 1). Its area has been reported as approximately 79.51 km² (Aholi et al., 2024). The wider Yala basin is described in regional baseline work by Boye et al. (2008). Rainfall is bimodal, comprising the March–May (MAM) long rains and October–December (OND) short rains. The Zaaba River and its tributaries form the principal surface water system.
Subsistence farming is the dominant economic activity. Food crops include maize, vegetables, beans, sweet potatoes, nuts, bananas, arrowroots, cassava, sorghum and millet. Tea is grown as a cash crop, and sugarcane is also cultivated. Livestock production includes the keeping of indigenous breeds. Other activities include quarrying for building stone, aquaculture, poultry production and extraction of sand from riverbeds. Trading centres include Luanda, Mbale and Majengo (County Government of Vihiga, 2014, 2018).
Data Sources
Daily rainfall records for 1991–2020 were obtained from the Kenya Meteorological Department. Missing rainfall values were estimated using the normal ratio method shown in Equation 1.
(1)
In Equation 1, Px is the estimated rainfall at the target station,Pi is the observed rainfall at neighbouring station i, Nx and Ni are the corresponding long-term mean rainfall values, and n is the number of neighbouring stations used. The subscript and summation notation refer to the same set of neighbouring stations.
Landsat imagery representing 2001, 2011 and 2020 was obtained through the United States Geological Survey EarthExplorer portal (https://earthexplorer.usgs.gov/). Landsat 7 is reported for 2001 and Landsat 8 for 2020. The 2011 sensor remains unidentified: Landsat 8 was launched on 11 February 2013 and cannot have supplied imagery acquired in 2011 (U.S. Geological Survey, n.d.). The six reported land cover categories were agricultural land, bare surfaces, built-up land, grassland, riparian cover and tree cover. Their relationship to the map legend is discussed under Land Cover Change.
Questionnaires, focus group discussions and key informant interviews provided information on socioeconomic activities, land cover change and perceived water-resource pressures. The reported sample comprised 150 respondents. Sample size was attributed to Yamane’s (1967) formula in Equation 2, where n is sample size, N is population size and e is precision. The population and precision underlying this sample cannot be established from the available study records. Respondent percentages are treated as descriptive because item-specific denominators and the selection procedure are undocumented.
(2)
Data Analysis
Rainfall Trends
Daily rainfall records were aggregated to monthly, seasonal and annual totals. This article reports using the Mann–Kendall test to assess monotonic trends and Sen’s slope estimator to estimate trend magnitude (Mann, 1945; Sen, 1968). The Mann–Kendall S statistic is defined in Equation 3. The trend estimates in the results are retained as reported because their original label, ‘Kendall slope’, does not establish whether they are Sen’s slopes or Kendall’s tau coefficients.
(3)
In Equation 3:
xj and xk are observations at times j and k, respectively;
n is the number of observations in the time series.
The sign function, sgn(x), is defined in Equation 4.
(4)
The variance of S, adjusted for tied observations, and the standardised test statistic, Z, are defined in Equations 5 and 6, respectively.
(5)
(6)
In Equation 5, tp is the number of observations in tied group p, and q is the number of tied groups. Under the standard normal approximation, a two-sided test at α = .05 rejects the null hypothesis of no monotonic trend when |Z| exceeds approximately 1.96.
A positive Z statistic indicates an upward trend and a negative Z statistic indicates a downward trend. Statistical significance depends on the magnitude of Z and its corresponding p-value, rather than on its sign alone.
Land Cover and Agricultural Livelihoods
Catchment topography and land cover maps were prepared using ArcGIS 10.3.1 and ERDAS IMAGINE. The related Zaaba paper describes supervised maximum-likelihood classification and comparison with field observations and high-resolution imagery using kappa (Aholi et al., 2026). Numerical accuracy results and validation records are unavailable here. Questionnaire responses were summarised as frequencies and percentages (Bluman, 2012). Aholi et al. (2024) identify the Water Resources Authority and Zaaba gauging station as the discharge-data source. The aggregation basis of the values in Table 4 remains undocumented; they are compared descriptively.
Results and Discussion
Seasonal and Annual Rainfall Patterns
The study area experiences the MAM long rains and OND short rains. Figures 2 and 3 show seasonal rainfall totals for 1991–2020. The highest and lowest MAM totals were reported in 2018 and 2014, respectively. The seasonal plots describe variation between years; monthly rainfall peaks cannot be established from these seasonal totals alone.
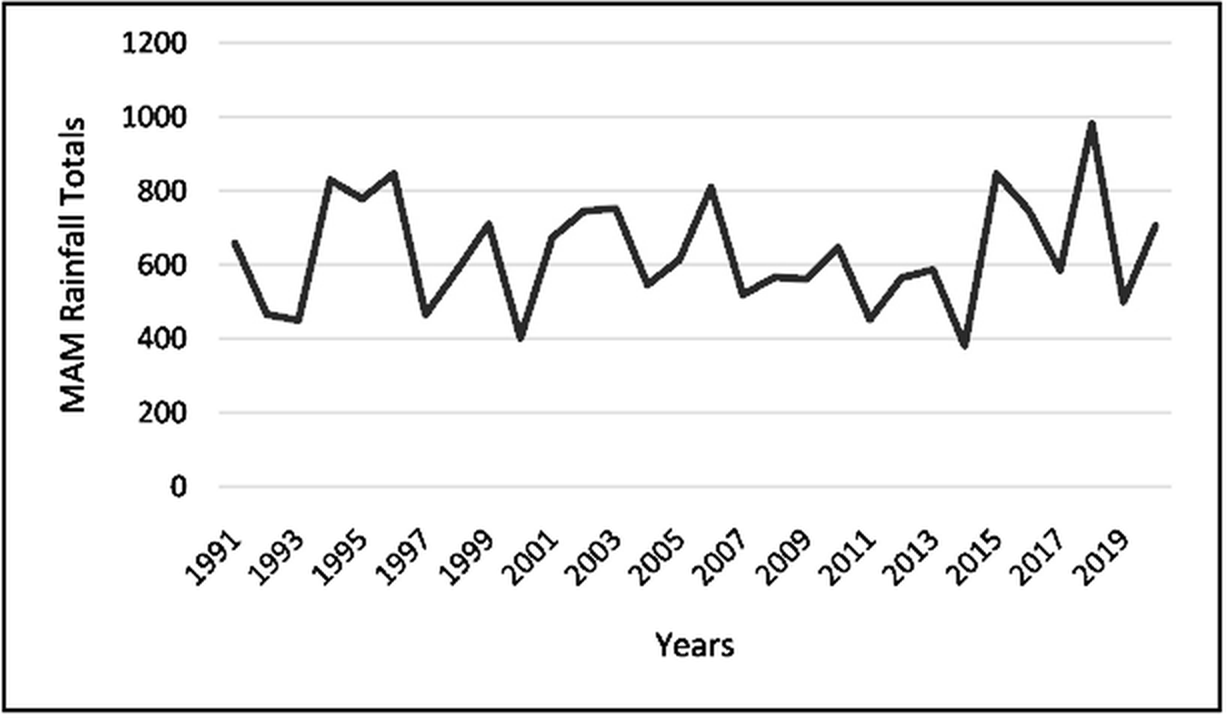
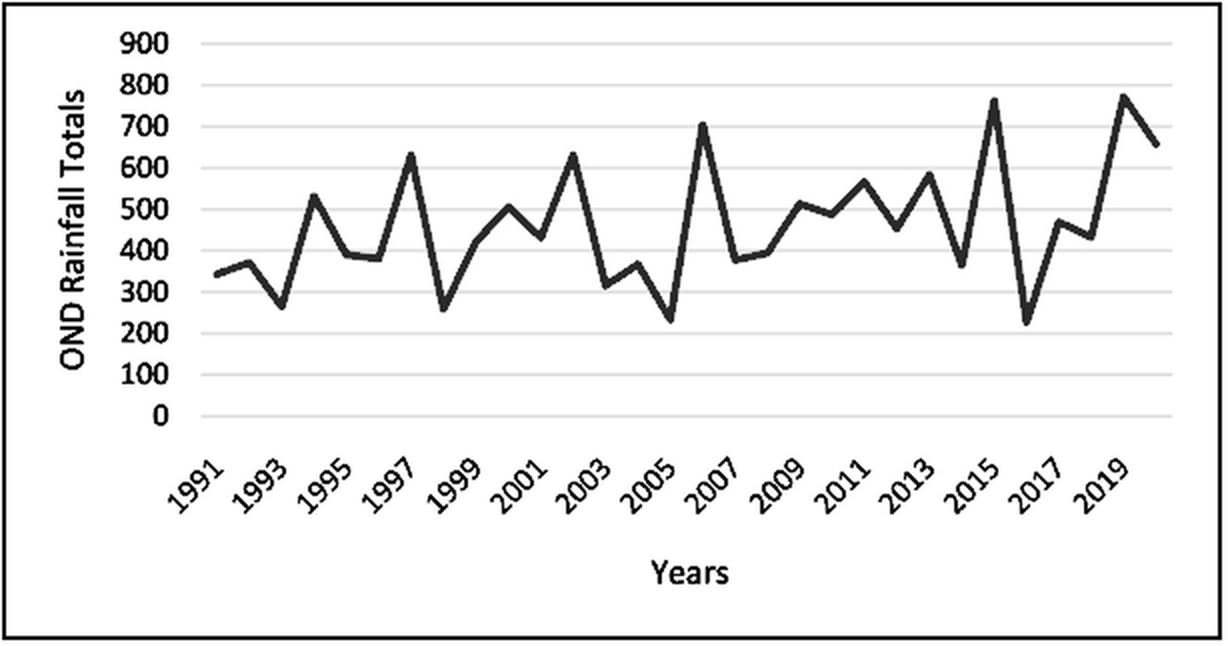
Table 1 presents the reported statistics for MAM and OND rainfall. The trend estimate was negative for MAM (−0.030) and positive for OND (0.136). The reported p-values were .043 and .046, respectively. However, these p-values are inconsistent with the accompanying Z statistics under the stated standard normal test, and the positive MAM Z statistic is inconsistent with the reported negative trend direction. Statistical significance and trend magnitude therefore require confirmation from the original analysis.
| Statistic | MAM | OND |
|---|---|---|
| p | .043 | .046 |
| Z | 1.407 | 3.83 |
| Trend estimate | −0.030 | 0.136 |
Note. Values are retained as reported. The p-values and Z statistics are inconsistent under the stated test. The original ‘Kendall slope’ label does not identify the estimator or its units.
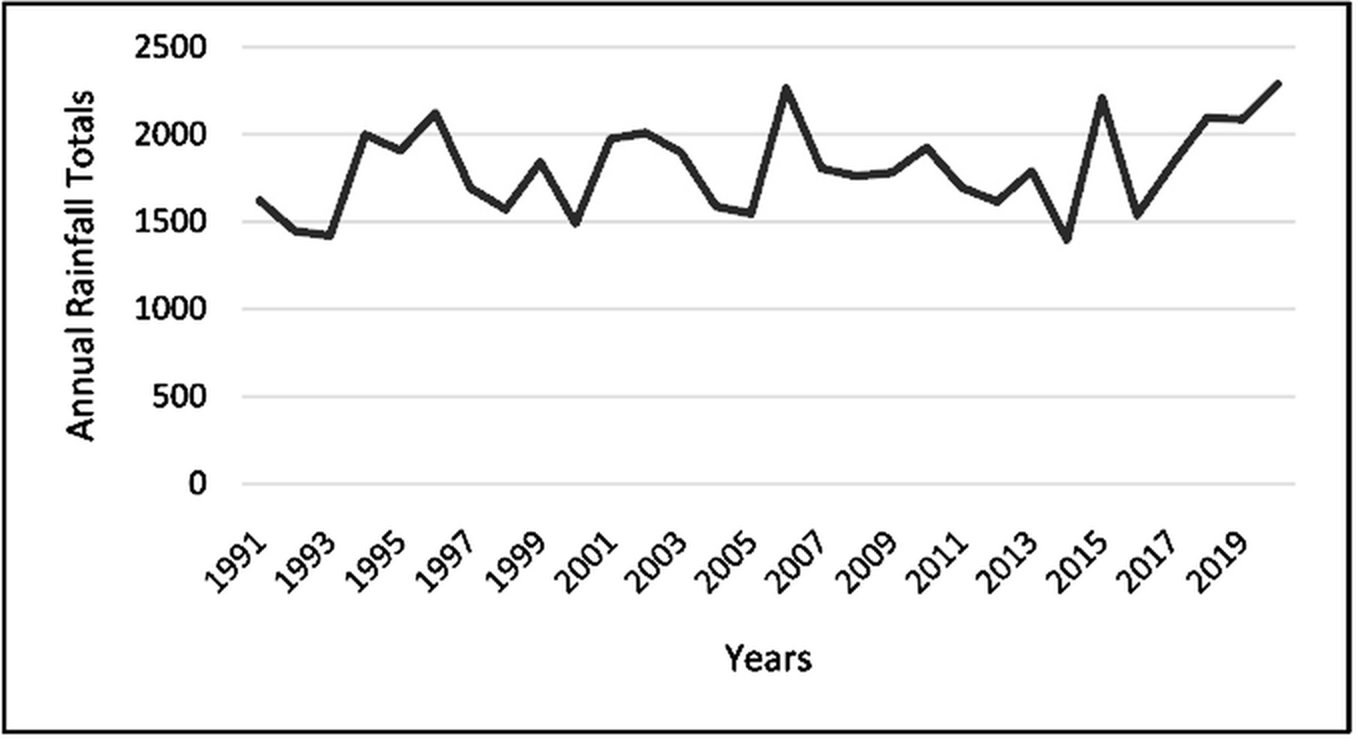
Figure 4 shows interannual variation in total annual rainfall during 1991–2020. Table 2 reports an annual trend estimate of 0.503 and p = .010. The accompanying Z statistic of 0.046 is incompatible with that p-value under the stated test. The annual rainfall series can be described visually, but its inferential interpretation remains unresolved.
| Statistic | Annual rainfall |
|---|---|
| p | .010 |
| Z | 0.046 |
| Trend estimate | 0.503 |
Note. Values are retained as reported. The p-values and Z statistics are inconsistent under the stated test. The original ‘Kendall slope’ label does not identify the estimator or its units.
Land Cover Change
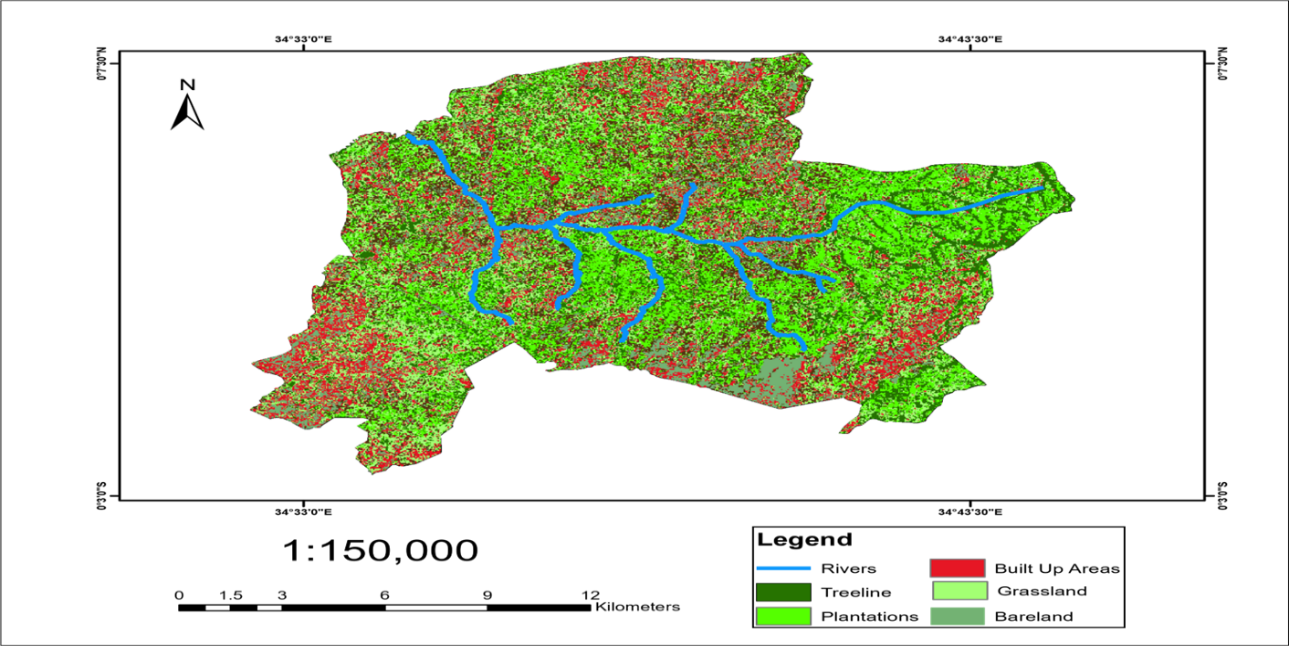
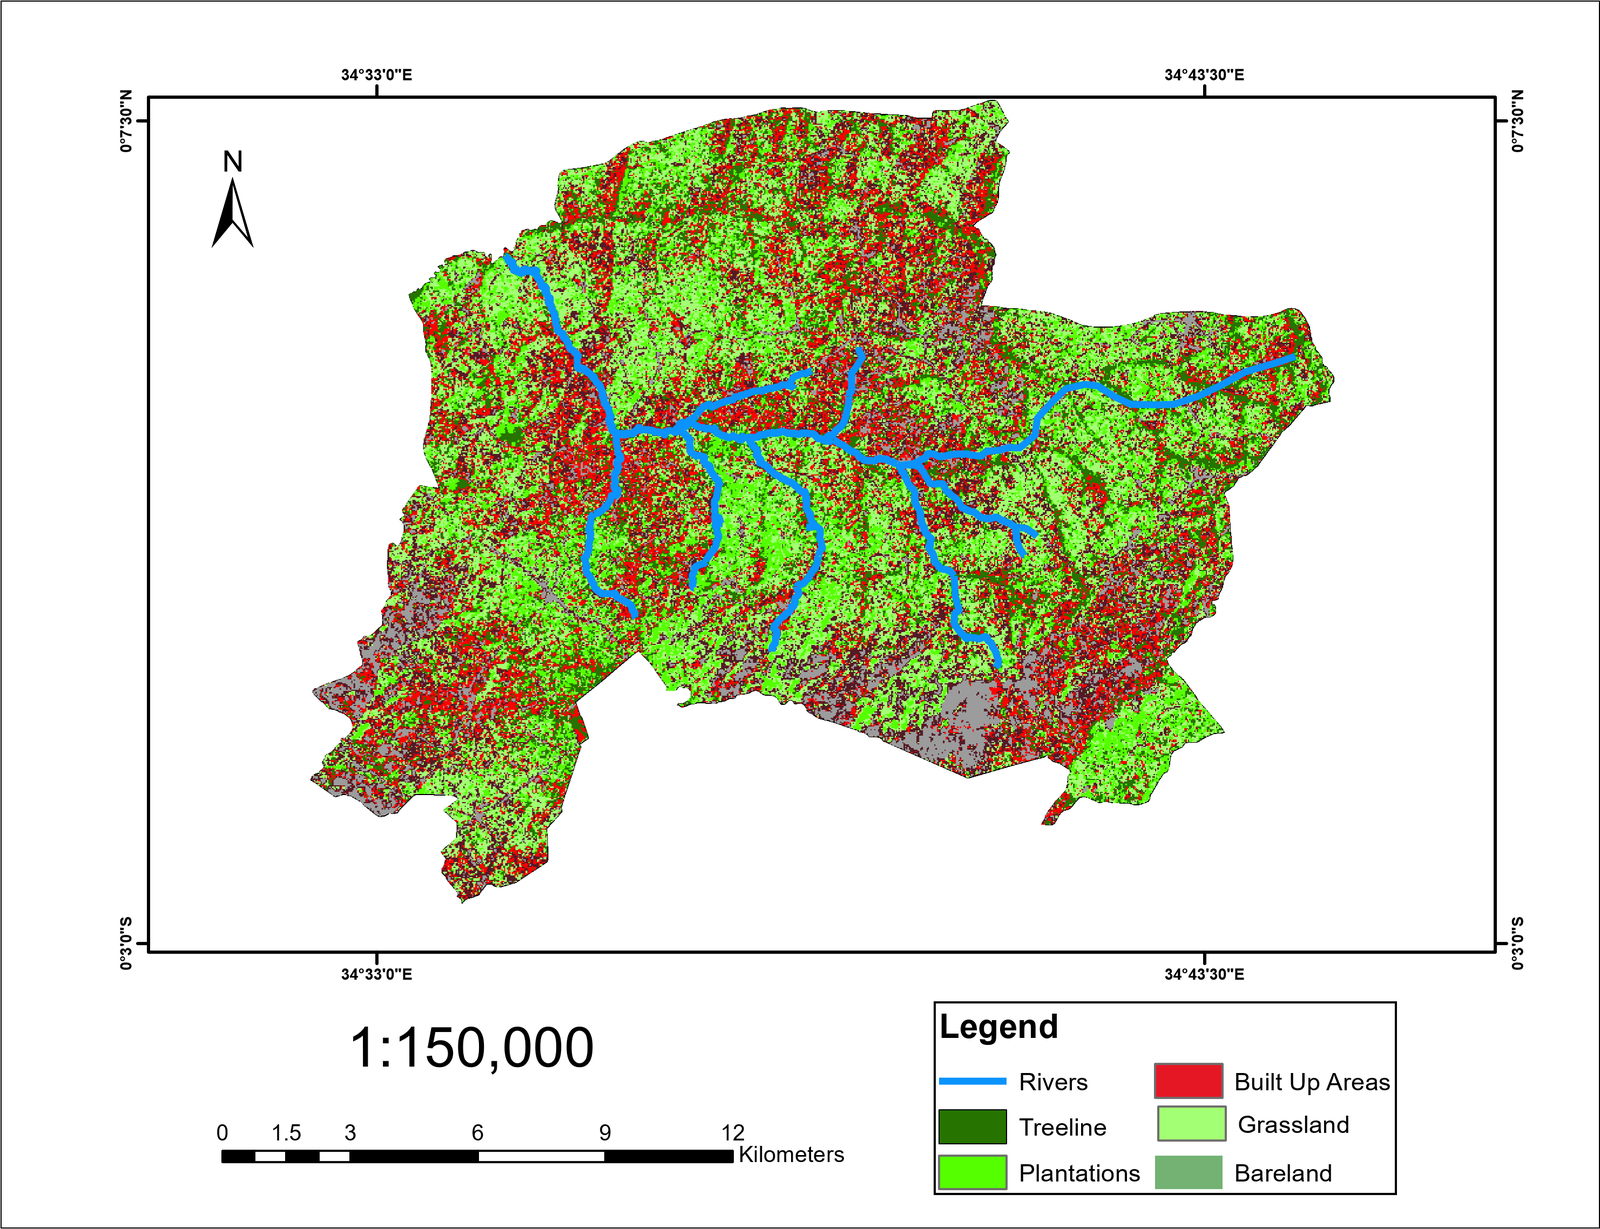
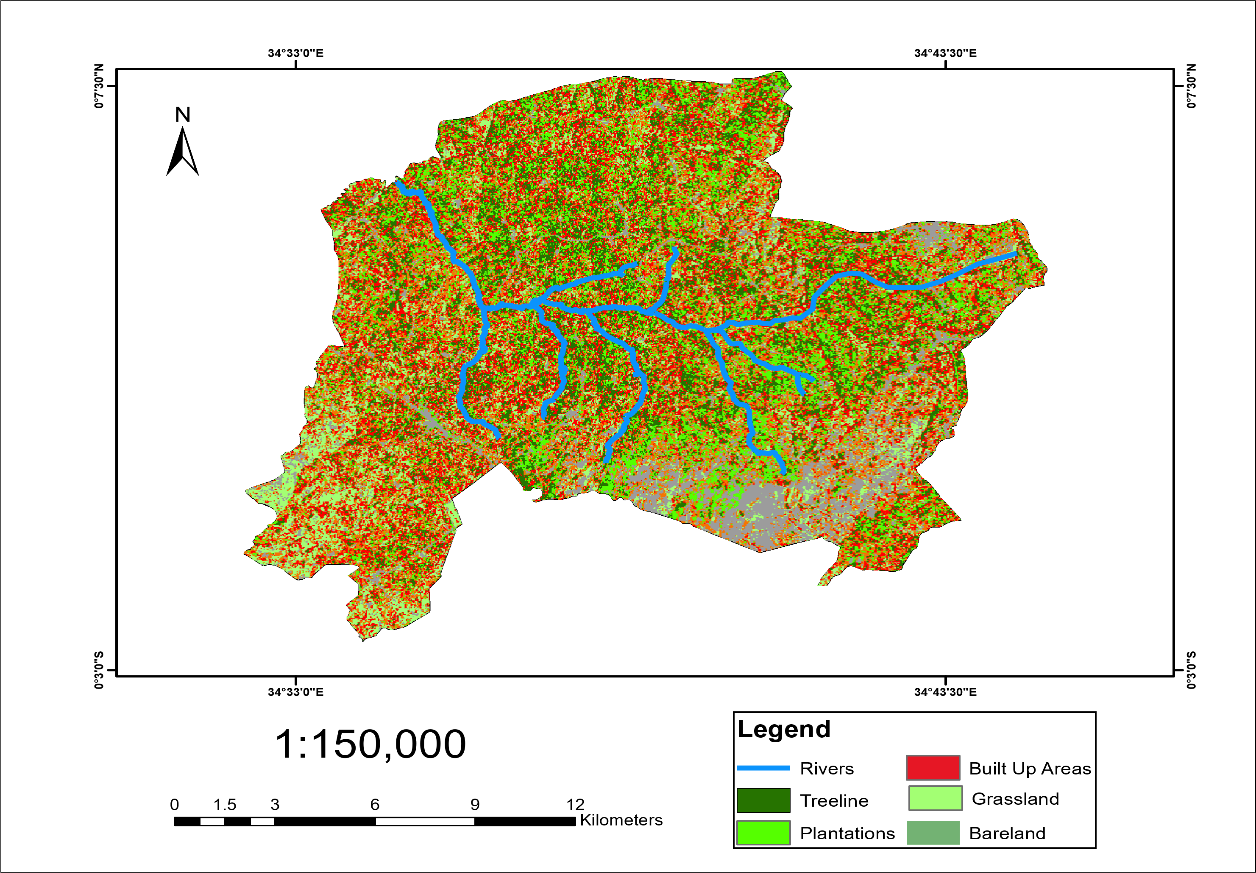
Figures 5–7 retain the map labels rivers, tree lines, plantations, built-up land, grassland and bare land. These labels are not treated as validated equivalents of the categories in Table 3. The table collates all six categories reported by Aholi et al. (2024). The 2011 total is 100.45%; the excess is too large to arise solely from rounding six percentages to two decimal places. Class definitions and the underlying classified areas therefore need reconciliation. No residual class or area has been inferred. The reported agricultural category decreases and the built-up category increases, but the figures do not quantify crop-yield effects (Jemberie et al., 2016; Kumba et al., 2015).
| Reported category | 2001 (%) | 2011 (%) | 2020 (%) |
|---|---|---|---|
| Agricultural land | 50.05 | 41.07 | 32.80 |
| Tree cover | 6.71 | 10.19 | 12.42 |
| Grassland | 2.29 | 1.92 | 12.36 |
| Riparian cover | 5.18 | 1.18 | 0.87 |
| Built-up land | 5.06 | 9.29 | 17.68 |
| Bare surfaces | 30.72 | 36.80 | 23.87 |
| Calculated total | 100.01 | 100.45 | 100.00 |
Note. Percentages from Aholi et al. (2024); totals calculated by addition. The 2011 discrepancy remains unresolved. No km² values or residual category were inferred. Map-label equivalence is unverified.
Rainfall Variability, Land Cover Change and Agricultural Livelihoods
Land cover can influence runoff, evapotranspiration, infiltration and discharge (Brouziyne et al., 2018; Kiluva et al., 2022; Odiero et al., 2018). Table 4 retains the seasonal values from the manuscript. Their pattern resembles the published comparison (Aholi et al., 2024), although some final decimal places differ. The three-year comparison does not separate land cover effects from rainfall variation or other drivers.
| Year | MAM discharge | OND discharge |
|---|---|---|
| 2001 | 156 | 64.9 |
| 2011 | 348.7 | 110.7 |
| 2020 | 206.9 | 101.8 |
Note. Values are retained from the manuscript. The related publication reports discharge in m³/s, but the seasonal aggregation and the units applicable to these particular values have not been established. No unit conversion or numerical replacement has been applied.
Eighty-three per cent of respondents identified mixed farming as the main economic activity. Common crops included maize, vegetables, beans, nuts and root crops; livestock included cattle, sheep, goats, pigs and poultry. The manuscript associates the 76% response with crop production or water availability; the earlier publication links it to rainfall-related discharge variability (Aholi et al., 2024). Its interpretation therefore remains uncertain. Reported pressures were settlement expansion (54%), deforestation (32%), urbanisation (8%), and wetland encroachment and stream channelisation (6%; Figure 8). These are perceptions, not measured causal contributions. Item denominators and single- or multiple-response coding are undocumented.
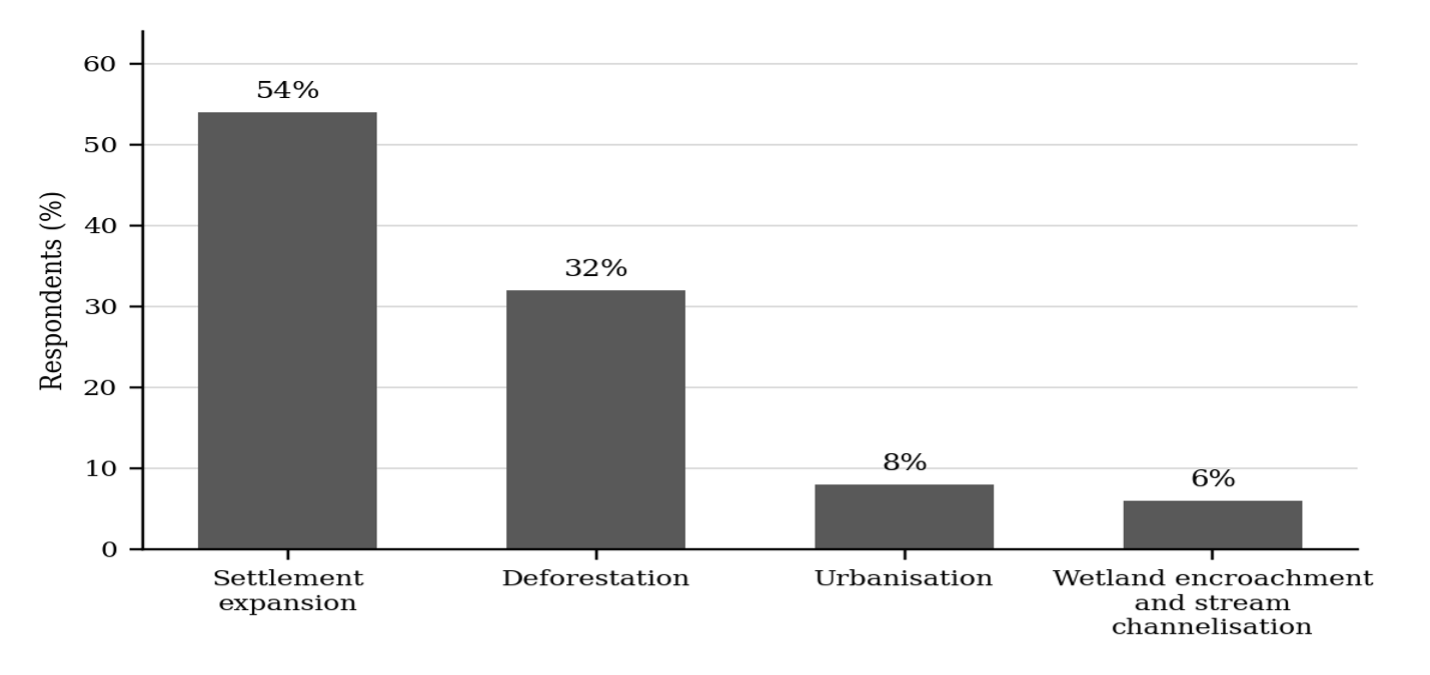
Note. Bars show the percentages reported in the text. The response denominator and category definitions require confirmation.
Scope and Limitations
Related Zaaba studies provide context (Aholi et al., 2024, 2026). This article does not establish an independent replication or a new causal estimate. Unresolved rainfall statistics, satellite identification, classification accuracy and response denominators constrain its conclusions. Agricultural productivity and household food security were not directly measured. Ethics approval and consent procedures are not documented in the available study records.
Conclusion
The reported trend estimates were negative for MAM rainfall and positive for OND and annual rainfall during 1991–2020. The corresponding p-values and Z statistics are internally inconsistent, so conclusions about statistically significant trends cannot be confirmed from the supplied results. Rechecking the original analysis is necessary before these estimates are used to support rainfall trend claims.
The reported agricultural category declined from 50.05% in 2001 to 32.80% in 2020, while built-up land increased from 5.06% to 17.68%. These patterns suggest pressure on agricultural livelihoods, but inconsistencies in class definitions and totals limit interpretation. Neither population-driven causation nor an effect on rainfall can be established from the comparisons.
Mixed farming was identified as the main economic activity by 83% of respondents. The findings support attention to riparian protection, sustainable land management and adaptation to rainfall variability. Effects on agricultural productivity and household food security require direct outcome measurements and a suitable analytical design.
References
Rights and permissions

Disclaimer
All claims expressed in this article are solely those of the author and do not necessarily represent those of the publisher, editors, reviewers, or affiliated institutions. Any product, service, or claim that may be evaluated in this article is not guaranteed or endorsed by the publisher.
Publisher’s note
The publisher remains neutral with regard to jurisdictional claims.
Declarations & editorial transparency
Data availability
Data availability is not applicable to this article because no new data were created or analysed.
Acknowledgements
Funding
This research received no specific grant from any funding agency in the public, commercial, or not-for-profit sectors.
Ethics declarations
Ethics approval was not required for this study.
Conflict of interest
The authors declare that they have no competing interests.
Peer review statement HRL Journal Service Policy
HRL Journal Service uses the following process for manuscripts sent for external peer review. An associate editor screens scope and eligibility; an academic editor assesses subject relevance and scholarly quality. The Editor-in-Chief and academic editor appoint suitable reviewers and manage conflicts of interest. Review is double blind: author and reviewer identities are concealed from one another during review. Authors respond to the feedback, with further review where needed. Once satisfied with the revisions, the academic editor recommends approval and forwards the manuscript for copyediting, reference checks and correction of typographical errors. The Editor-in-Chief makes the final publication decision. Article-specific review records and any exceptions are reported separately below.
Article-specific review status not recorded
Academic editor names are published according to the journal’s disclosure policy and the editor’s consent. An editor may request non-display; authors may raise a reasoned concern, which the journal assesses for privacy, safety and conflicts of interest. A missing name alone does not establish the reason for non-display or imply an ethics concern. Reviewer anonymity during double-blind review is a separate matter.
AI use & language assistance HRL Journal Service Policy
Authors and copyeditors may use language-assistance tools, including Grammarly, to improve spelling, grammar and readability under human supervision. Edits must preserve scientific meaning, uncertainty and the authors’ interpretation. Authors remain responsible for the accuracy, originality, references and integrity of their work; AI tools cannot qualify as authors or replace editorial judgement. Authors must disclose AI assistance at submission. Generative rewriting, content creation or use in research methods, analysis or figures requires an article-specific statement identifying the tool and its purpose; no use may fabricate data, sources or findings. Confidential manuscripts and personal data must not be shared with external tools without appropriate permission and confidentiality safeguards. This shared policy does not establish whether a tool was used in this article; any supplied article-specific disclosure appears below.
Publication timeline
Recorded milestones for this article. Only supplied dates are shown.
- Received
- Revised
- Accepted
- Published
How the HRL review process works
The standard route for manuscripts sent for external peer review; this illustration does not certify individual stages or supply missing dates.
- 01Scope & eligibilityAssociate editor
- 02Subject assessmentAcademic editor
- 03Double-blind peer reviewReviewers appointed by the editorial team
- 04Revisions & academic approvalAuthors respond; academic editor evaluates
- 05Copyediting & reference checksCopyeditor
- 06Final publication decisionEditor-in-Chief
Cite this article
Share this article
Share the article record with colleagues and readers worldwide.
Explore research across our journalsDiscover more research

Recent Publications

Most Read

Recommended
Save this article as a bookmark
Use your browser’s secure bookmark shortcut. Both desktop options are shown below.
Press Ctrl+D
In Chrome, Edge or Firefox, choose a folder if needed, then select Done.
Press ⌘ Command+D
In Safari, Chrome or Firefox, choose the bookmark location and confirm.
Add to Mendeley
Save this article’s reference using either option below.
Import a reference file
Download the RIS file, then import it in Mendeley Reference Manager using Add new → Import library, or drag the file into your library.
Download RIS for MendeleyUse Mendeley Web Importer
With the extension installed, return to this article and select the Mendeley icon in your browser toolbar. Review the detected reference before saving.
Get the official Web ImporterYou choose what to import. Opening this dialog does not sign you in or send article content to Mendeley.
Cite this article
Copy a formatted citation or download a reference file.
Cited by
Crossref citation count for this DOI.