Tax-Induced Investment Diversion A Comparative Analysis of Kenya and Uganda
This paper develops an empirical framework to evaluate how corporate tax regimes influence investment diversion across borders, reframing statutory parameters into an investment-relevance index. Using corporate tax provisions from Kenya and Uganda for 2024/2025, an Investment Burden Index (IBI) was constructed from nineteen statutory parameters, including VAT, excises, stamp duties, withholding taxes, capital gains, and loss carry-forward. Each parameter was normalised, weighted by investment relevance, and aggregated to yield country-level scores, which were then linked with UNCTAD FDI inflows and outflows for 2023. The results indicate that Uganda’s tax system imposes a higher statutory burden (IBI –2.16) compared to Kenya (IBI –0.33), yet Uganda attracted larger FDI inflows in 2023 (USD 1.55 billion versus USD 0.46 billion). This underscores the mediating role of sector-specific opportunities, particularly energy and oil, which offset statutory disadvantages. The study contributes to debates on tax-induced diversion by showing that while corporate taxation matters, its impact is conditional and interacts with non-tax determinants such as natural resources and macroeconomic stability.
1. Introduction
In an era of unprecedented capital mobility, national tax policies have evolved from being purely a domestic concern to a critical determinant of international investment flows. The foundational theory of tax-induced investment diversion posits that in a globalised economy, firms will strategically locate or expand their operations in jurisdictions that offer a higher after-tax return on investment ((Desai et al., 2005)). This is rooted in the classical economic principles of comparative advantage and the modern literature on capital mobility, which suggests that capital is 'footloose' and will seek out the most favourable fiscal climates ((Zodrow, 2009)). The phenomenon is often framed within the context of corporate tax competition, where countries engage in a 'race to the bottom' by lowering corporate tax rates or offering generous incentives to attract foreign direct investment (FDI) ((Erokhin, 2023; Tanzi & Zee, 2001)).
Tax-induced investment diversion refers to the redirection of capital flows across jurisdictions as firms adjust to differences in statutory or effective tax burdens ((Erokhin, 2023)). When corporate taxes increase the cost of doing business in one country relative to another, investors may shift their portfolios, relocate projects, or alter profit-reporting strategies to exploit more favourable tax environments. This phenomenon is particularly acute in developing economies where non-tax conditions (infrastructure, political risk, and institutional quality) are relatively similar, amplifying the role of taxation as a decisive factor in cross-border capital allocation.
In East Africa, Kenya and Uganda provide an important comparative case, given their shared integration agenda under the East African Community (EAC), structural similarities in market size, and geographical proximity, yet divergent approaches to corporate taxation. Uganda maintains relatively higher statutory tax burdens, while Kenya has adopted more incentive-driven provisions, such as indefinite loss carry-forward and targeted exemptions, creating the potential for asymmetric investment responses.
The debate on corporate tax competition and base erosion and profit shifting (BEPS) underscores why such divergence matters. The OECD’s ongoing BEPS initiative highlights how multinational corporations exploit tax differentials to shift profits and investment flows, often at the expense of higher-tax jurisdictions ((OECD, 2023)). In Africa, where fiscal space is constrained, governments face a dual challenge: mobilising revenue while competing for foreign direct investment (FDI). The resulting competition has encouraged selective tax incentives, exemptions, and holidays, which in turn reshape the investment geography within the continent ((IMF, 2023)). Kenya’s strategy aligns more closely with competitive tax positioning, while Uganda emphasises predictable but relatively higher statutory rates, positioning it differently in the competition for capital within the EAC bloc.
Determinants of FDI in Africa further contextualise this dynamic. (UNCTAD, 2023) reports that East Africa attracted rising inflows in 2023, with Uganda drawing US$1.55 billion largely due to oil-sector investments, while Kenya received US$461 million despite its comparatively lighter statutory burden. This outcome highlights the interaction between taxation and sector-specific factors: fiscal incentives may not fully compensate for structural pull factors such as natural resource endowments or regional trade positioning. Nonetheless, taxation remains central to investor calculus, as high excises, capital gains taxes, and withholding levies increase capital costs, while provisions such as VAT thresholds and indefinite loss carry-forward reduce them.
The academic discourse on this subject has yielded a complex and sometimes contradictory body of evidence. Early studies, such as those by (Agodo, 1978) and (Hartman, 1982), found little to no significant relationship between host country taxes and FDI attraction, suggesting that other factors like market size, political stability, and infrastructure were more influential. However, more recent and methodologically robust research has provided compelling evidence of a significant negative relationship between corporate tax rates and FDI inflows ((Cleeve, 2008; Ferguson et al., 2025)). The IMF has also weighed in, noting that while tax incentives are a common tool to attract investment, their effectiveness is highly questionable, often leading to substantial revenue losses for governments with no guarantee of attracting new capital ((IMF, 2024; IMF, 2023)). This is particularly true in developing countries where a lack of strong governance can lead to rent-seeking and the proliferation of poorly targeted incentives ((Tanzi & Zee, 2001)).
This competitive landscape has intensified with the rise of multinational enterprises (MNEs) and the emergence of global reforms such as the OECD's Base Erosion and Profit Shifting (BEPS) project. The BEPS initiative, which aims to curb tax avoidance, has created a new layer of complexity for countries seeking to attract investment while protecting their tax base ((Tibor & Whyman, 2025)). While BEPS is intended to create a fairer global tax system, some scholars and policy experts express concern that it may inadvertently disadvantage developing countries. The proposed global minimum tax of 15%, for instance, is well below the statutory corporate tax rates of many African nations, potentially creating a new set of challenges for tax authorities ((Ferguson et al., 2025)). The debate is therefore shifting from the simple effect of tax rates to the broader impact of a country's entire tax regime including its complexity, administrative burden, and specific incentives on the investment decisions of MNEs ((Tibor & Whyman, 2025)).
In the East African Community (EAC) context, this issue is particularly acute. Both Kenya and Uganda are competing for regional hub status, and their respective tax policies are a key battleground. Kenya, the region's largest economy, has a relatively high tax-to-GDP ratio but has also enacted reforms to attract investment ((Tewodros, 2025)). Uganda, on the other hand, is leveraging its emerging oil industry and a rapidly growing population to attract FDI ((International Trade Administration, 2023a; Tewodros Sisay, 2025)). The EAC Customs Union aims for harmonisation, yet persistent tax differentials between member states create opportunities for investment diversion. A 2024 study on FDI determinants in Uganda found that while market size and infrastructure were the primary drivers, policy factors including tax rates played a supportive role, with paying taxes having a negative impact on FDI inflows ((International Trade Administration, 2023b)). The question, then, is not whether tax policy matters, but how specific corporate tax parameters interact to influence investment decisions in a competitive regional environment.
The problem this study addresses is the limited understanding of how specific corporate tax differentials, beyond simple tax rates, influence investment decisions in a developing country context. While broad studies in East Africa have shown a link between taxes and FDI, few have delved into the granular details of how specific tax parameters such as Withholding Tax (WHT) on dividends, indefinite loss carry-forward provisions, or excise duties on key inputs create a cumulative "investment burden" that can distort capital flows between close neighbours. The existing literature often focuses on macroeconomic variables like GDP and trade openness, or on broad fiscal incentives, but fails to capture the intricate, firm-level considerations that can lead a multinational to choose one jurisdiction over another. A deeper comparative analysis of Kenya and Uganda is therefore necessary to bridge this gap in the literature and provide pathways for this study.
Thus, from above, this paper claims that “Corporate tax regimes in East Africa do not simply influence revenue collection; they shape the geography of foreign direct investment flows.” Using Uganda and Kenya as comparative cases, this study demonstrates that statutory tax parameters, when reframed into an investment burden index, are associated with observable differences in FDI inflows, outflows, and sectoral capital allocation, thus providing evidence of tax-induced investment diversion. To ascertain this claim, the paper pursued three objectives: (a) to compare the statutory frameworks of the two countries, (b) to numerically evaluate differences in key tax parameters, and (c) to analyse their implications for possible sectoral investment diversion. This paper hence contributes to understanding how corporate taxation mediates capital flows between Uganda and Kenya within the broader literature on tax-induced investment diversion through reframing statutory parameters into an Investment Burden Index (IBI) and linking these to observed FDI outcomes.
2. Methods
2.1 Sample and Population
The analytical population for this study consists of statutory corporate-facing tax parameters in force during the fiscal year 2024/2025 in Kenya and Uganda. These countries were purposively selected because they are both members of the East African Community (EAC), share strong trade linkages, and exhibit different tax policy traditions despite geographical proximity. The “sample” is not a probabilistic draw but rather the complete set of legal provisions governing corporate taxation in the two jurisdictions during the period under review. By focusing on the entire statutory framework, the analysis ensures that no relevant policy lever affecting corporate investment decisions was omitted.
2.2 Data
Data were secondary in nature and derived from official government statutes, parliamentary amendments, international financial institutions, and professional tax advisory reports. For Uganda, the sources included the Uganda Tax Amendments 2024–2025 published by the Ministry of Finance, the Income Tax (Amendment) Bill 2025 as tabled in Parliament, the Uganda Revenue Authority’s Taxation Handbook (second edition, 2022), and the PwC Uganda Corporate Tax Summaries (2025). For Kenya, the primary documents were the Finance Act 2025 as published in the Kenya Gazette, the PwC Kenya Corporate Tax Summaries (2025), and the KPMG Finance Act 2025 Analysis.
These tax data represent statutory provisions effective in or legislated for the fiscal year beginning July 2024 and ending June 2025. To link statutory burdens to actual economic performance, complementary macroeconomic and investment data were incorporated. Foreign direct investment inflows and outflows for 2023 (measured in millions of US dollars) were obtained from the UNCTAD World Investment Report 2023. Projections of GDP growth for 2024 and 2025 were sourced from the East Africa Economic Outlook 2025, while structural macroeconomic indicators such as GDP per capita and trade openness were taken from the World Bank World Development Indicators (2023 release). All financial figures were harmonised to constant US dollars. Where statutory amounts were specified in local currencies, these were converted into US dollars using average market exchange rates prevailing in 2024, namely UGX 3,800 per USD and KES 135 per USD. This ensured comparability across the two jurisdictions.
2.3 Variables and Model
Nineteen statutory parameters were identified as directly relevant to corporate taxation in the two countries. These included consumption-based measures such as the standard VAT rate and the statutory VAT registration threshold, excise duties on fuel products and alcoholic beverages, various stamp duties, withholding taxes on dividends, interest, royalties, technical and management fees, and contractor payments, as well as capital gains tax, payroll and environmental levies, and the maximum period for loss carry-forward. All variables were first extracted in their statutory form, expressed either in percentages, US dollars (converted from local currencies using average 2024 exchange rates of UGX 3,800 = USD 1 and KES 135 = USD 1), or years. For comparability, where Kenya’s loss carry-forward was legally defined as “indefinite,” this was operationalised as ninety-nine years.
Because these variables were expressed in heterogeneous units, they were normalised to a common scale. A min–max procedure was used such that for each parameter i, the score for country c was computed as:
where \(x_{(c,i)}\) is the raw statutory value of parameter i in country c. This transformation rescales the values into the interval [0,1], ensuring comparability across different tax categories.
To orient the normalised variables according to their economic impact on investment, directional weights were applied. Formally, each parameter was assigned a weight \(w_i\), where \(w_i = +1\) if higher values are investment-friendly (e.g., VAT threshold, loss carry-forward), \(w_i = -1\) if higher values represent investment frictions (e.g., VAT rates, excises, withholding taxes, levies, capital gains tax), and \(w_i = 0\) if the effect is neutral. Each country's contribution for parameter i was then defined as:
Summing across all \(k = 19\) parameters yielded the overall Investment Burden Index (IBI) for each country:
The practical application of this procedure can be illustrated with several worked examples. Uganda’s excise duty on petrol was 0.38 USD per litre compared with Kenya’s 0.16 USD. With a minimum of 0.16 and a maximum of 0.38, Uganda’s normalised score was (0.38 − 0.16) / 0.22 = 1.0, while Kenya’s was 0.0. Applying the negative weight (\(w = -1\)) gave contributions of –1.0 for Uganda and 0.0 for Kenya. Similarly, Uganda’s loss carry-forward period of seven years compared to Kenya’s ninety-nine years resulted in a normalised score of 0.0 for Uganda and 1.0 for Kenya. With a positive weight (\(w = +1\)), this yielded contributions of 0.0 for Uganda and +1.0 for Kenya. A further example is the capital gains tax, where Uganda applied a 30% rate and Kenya 5%. Normalisation gave Uganda 1.0 and Kenya 0.0, and with a negative weight, contributions of –1.0 and 0.0 respectively.
Following this systematic procedure across all nineteen parameters generated the parameter-level contributions presented in Table 2 and the aggregated totals reported in Table 1, with Uganda scoring –2.16 and Kenya –0.33. Finally, to evaluate the relationship between tax burden and investment outcomes, the aggregated indices were merged with secondary macroeconomic indicators. Specifically, foreign direct investment inflows and outflows for 2023 were obtained from UNCTAD, while GDP growth projections for 2024–2025 were drawn from the East Africa Economic Outlook (2025). This integration produced the results in Table 3.
3. Results
This section presents the empirical results of the study, beginning with the parameter-level Investment Burden Index (IBI) scores for Uganda and Kenya and progressing to their aggregated indices. The findings integrate statutory tax burdens with foreign direct investment (FDI) inflows and outflows, thereby linking fiscal regimes to actual investment patterns. Thus, Table 1 and Figure 1 findings disaggregate the aggregated IBI score into tax categories (VAT, excise, WHT, etc.) to show which statutory components drive the investment burden. This breakdown provides clarity on the structural composition of the IBI, but it remains descriptive in nature, as it illustrates rather than tests statistical differences.
| Parameter | Uganda IBI | Kenya IBI |
|---|---|---|
| VAT Rate (%) | -0.250 | -0.001 |
| VAT Threshold (USD) | 0.005 | 0.000 |
| Excise Petrol (USD/l) | -0.003 | -0.000 |
| Excise Diesel (USD/l) | -0.002 | -0.001 |
| Excise Beer (%) | -0.667 | -0.000 |
| Excise Spirits (%) | -1.000 | -0.000 |
| Stamp Duty General (%) | -0.013 | -0.000 |
| Stamp Duty Mortgages (%) | -0.006 | -0.000 |
| Stamp Duty Leases (%) | -0.013 | -0.000 |
| WHT Dividends (%) | -0.167 | -0.000 |
| WHT Interest (%) | -0.000 | -0.000 |
| WHT Royalties (%) | -0.000 | -0.333 |
| WHT Technical Fees (%) | -0.000 | -0.333 |
| WHT Contractors Residents (%) | -0.100 | -0.000 |
| WHT Contractors Non-Residents (%) | -0.250 | -0.333 |
| Capital Gains Tax (%) | -0.375 | -0.000 |
| Payroll Levy (%) | -0.025 | -0.000 |
| Environmental Levy (%) | -0.025 | -0.000 |
| Loss Carry-forward (Years) | 0.000 | 1.000 |
| Aggregated | –2.16 | –0.33 |
Uganda’s heavier burdens are concentrated in excises, capital gains tax, and dividend WHT, whereas Kenya’s main burdens stem from royalties, technical fees, and non-resident contractor WHT. Kenya benefits strongly from its indefinite loss carry-forward provision, which offsets its other statutory disadvantages. Table 2 findings integrate the aggregated IBI with foreign direct investment (FDI) inflows and outflows for the year 2023.
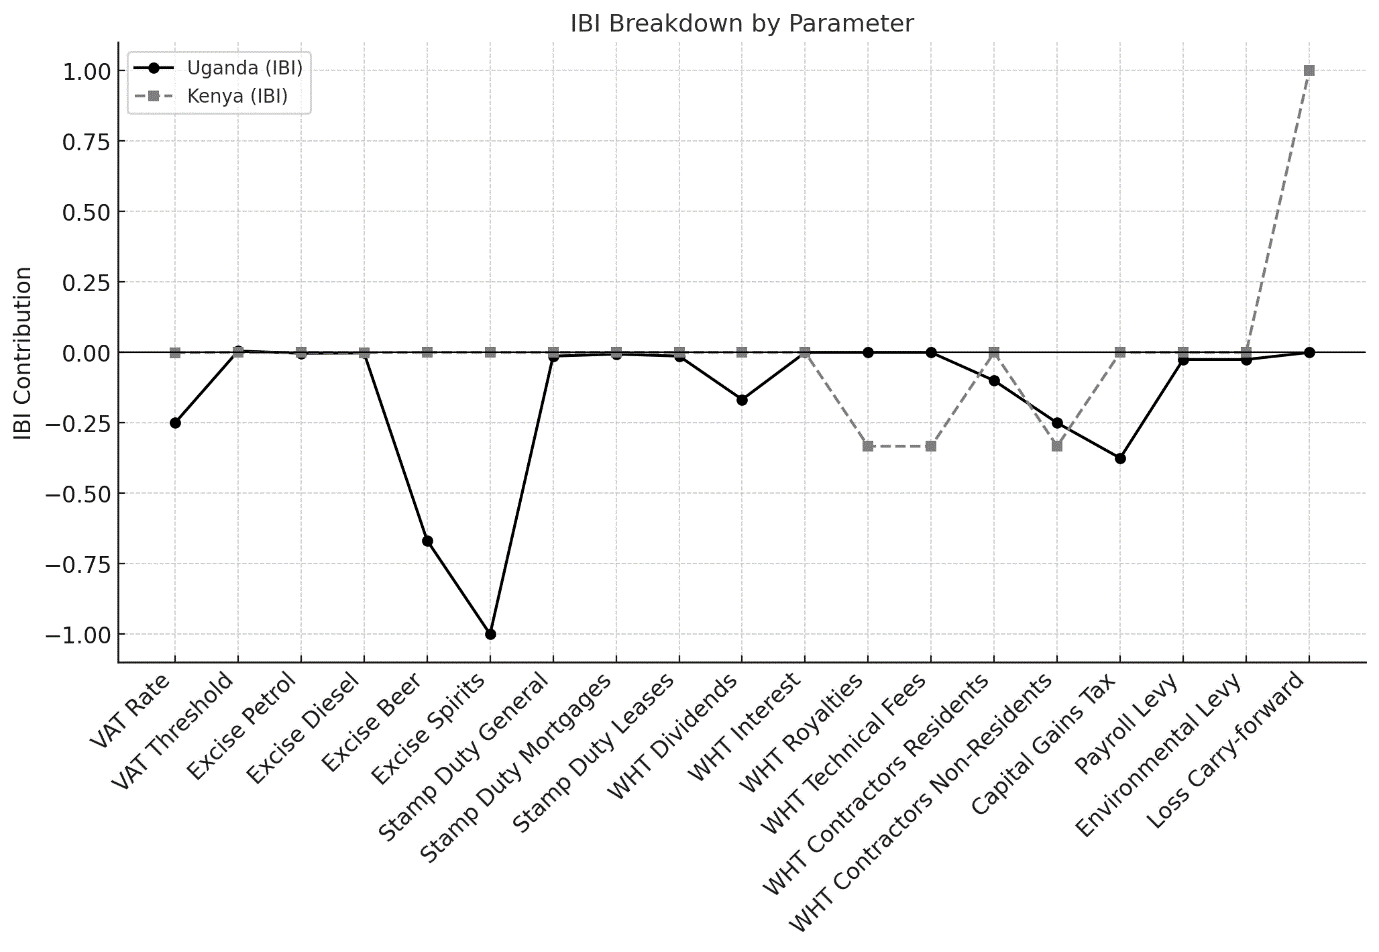
Uganda’s IBI contributions are consistently more negative across almost all parameters, with steep declines for excise on beer (–0.667), spirits (–1.000), and capital gains tax (–0.375), while Kenya’s values remain close to zero except for a positive score of +1.000 for loss carry-forward (See Figure 1). This demonstrates that Uganda’s statutory regime imposes heavier frictions on average than Kenya’s.
| Parameter | Uganda (Value) | Kenya (Value) | Weight | Uganda IBI | Kenya IBI |
|---|---|---|---|---|---|
| VAT Rate (%) | 18 | 16 | –1 | –0.947 | –0.842 |
| VAT Threshold (USD) | 39,474 | 37,037 | +1 | 0.994 | 0.932 |
| Excise Petrol (USD/l) | 0.38 | 0.16 | –1 | –0.242 | –0.102 |
| Excise Diesel (USD/l) | 0.30 | 0.14 | –1 | –0.225 | –0.105 |
| Excise Beer (%) | 60 | 10 | –1 | –1.000 | –0.167 |
| Excise Spirits (%) | 80 | 35 | –1 | –1.000 | –0.438 |
| Stamp Duty General (%) | 1.00 | 1.00 | –1 | –0.500 | –0.500 |
| Stamp Duty Mortgages (%) | 0.50 | 0.10 | –1 | –0.400 | –0.080 |
| Stamp Duty Leases (%) | 1.00 | 2.00 | –1 | –0.333 | –0.667 |
| WHT Dividends (%) | 15 | 5 | –1 | –0.750 | –0.250 |
| WHT Interest (%) | 15 | 15 | –1 | –0.500 | –0.500 |
| WHT Royalties (%) | 15 | 20 | –1 | –0.375 | –0.500 |
| WHT Technical Fees (%) | 15 | 20 | –1 | –0.375 | –0.500 |
| WHT Contractors Residents (%) | 6 | 3 | –1 | –0.600 | –0.300 |
| WHT Contractors Non-Residents (%) | 15 | 20 | –1 | –0.375 | –0.500 |
| Capital Gains Tax (%) | 30 | 5 | –1 | –1.000 | –0.167 |
| Payroll Levy (%) | 2 | 1.5 | –1 | –1.000 | –0.750 |
| Environmental Levy (%) | 2 | 0 | –1 | –1.000 | 0.000 |
| Loss Carry-forward (Years) | 7 | 99 | +1 | 0.071 | 1.000 |
| Aggregated IBI Score | Uganda: 0.993302; Kenya: 0.998518 | ||||
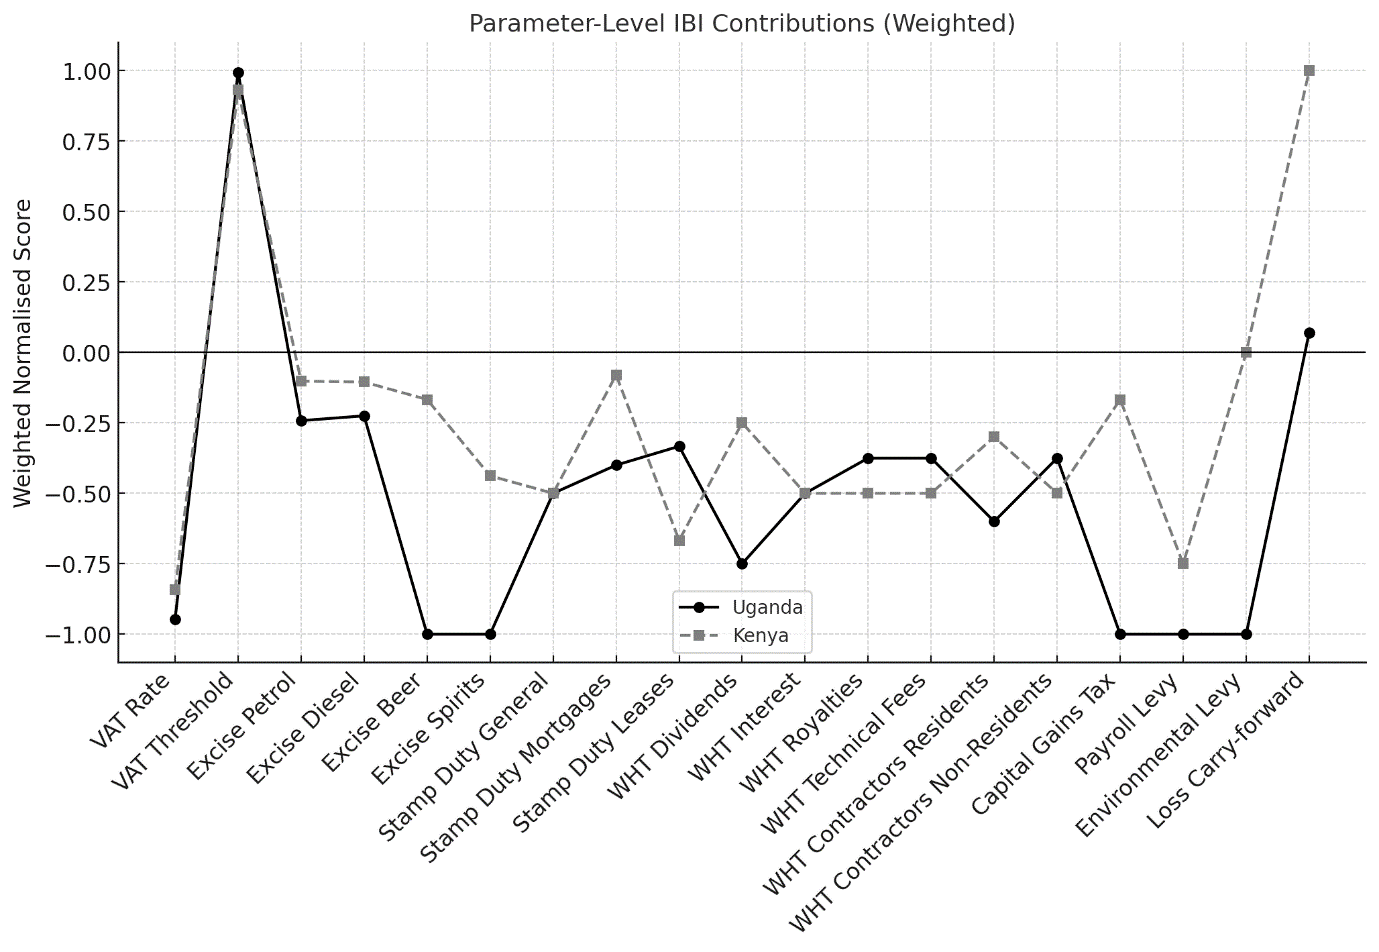
Figure 2 confirms this disparity at the weighted parameter level. Uganda registers strong negative contributions from fuel excises (–0.242 petrol, –0.225 diesel) and payroll and environmental levies (both –1.000), while Kenya’s burdens are lighter (e.g., –0.102 petrol, –0.105 diesel). Kenya, again, is advantaged by its extended loss carry-forward, which scores +1.000 against Uganda’s marginal +0.071. Table 3 combines the Investment Burden Index (IBI) scores with UNCTAD 2023 FDI inflows and outflows for Kenya and Uganda. This way, the paper can directly compare tax burden vs. real investment flows.
| Country | Aggregated IBI Score | FDI Inflows (US$ millions) | FDI Outflows (US$ millions) | GDP Growth (2024–25) |
|---|---|---|---|---|
| Uganda | –2.16 | 1,553 | 1,717 | 6.1% (2024) |
| Kenya | –0.33 | 461 | 1,379 | 5.3% (2025) |
Uganda shows a heavier investment burden (–2.16), yet its FDI inflows (US$ 1.55B) are significantly higher than Kenya’s (US$ 461M). This suggests that sector-specific factors (e.g., oil investments, regional trade hub role) outweigh statutory tax disadvantages. Kenya, despite its lighter burden (–0.33), attracted far less FDI inflow, which may reflect non-tax barriers such as political risk, regulatory unpredictability, or competition from neighbouring markets. The outflows are high in both countries, reflecting regional reinvestment strategies by local firms.
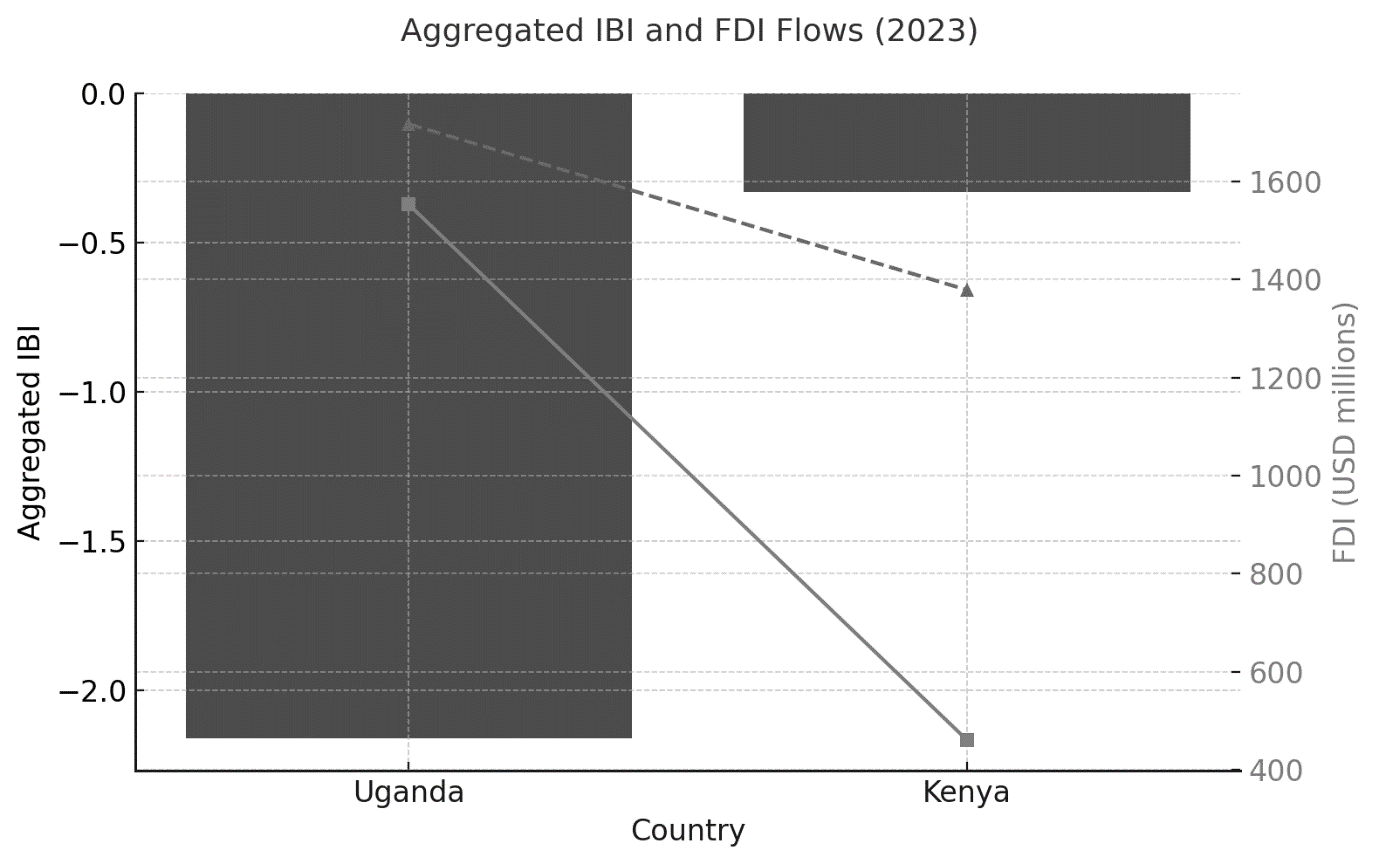
The third chart combines the aggregate IBI scores with investment outcomes. Uganda’s IBI of –2.16 is considerably lower than Kenya’s –0.33, signalling a heavier statutory burden. Yet, paradoxically, Uganda attracted higher FDI inflows in 2023 (USD 1,553 million compared to Kenya’s USD 461 million) and also recorded larger outflows (USD 1,717 million versus USD 1,379 million). This juxtaposition illustrates that while taxation shapes burdens, investment flows respond strongly to other structural factors, notably Uganda’s oil-sector projects.
4. Discussion
The purpose of this study was to determine whether differences in corporate tax regimes between Kenya and Uganda produce measurable investment frictions that contribute to diversion of capital flows. The descriptive tables constructed in this paper provide both an aggregate and disaggregated view of these regimes, enabling an assessment of the claim and objectives.
The Parameter-Level Investment Burden Index (IBI) Contributions (see Table 2) demonstrates that Uganda’s statutory framework imposes heavier burdens through excises, capital gains tax, and withholding levies. Kenya, in contrast, exhibits burdens in royalties, technical fees, and non-resident contractor taxation but benefits disproportionately from the indefinite loss carry-forward provision. This disaggregated analysis confirms the first objective of identifying similarities and differences: while both countries rely on withholding as a key revenue instrument, Uganda’s reliance on high excises and capital taxes tilts its regime toward revenue mobilisation, whereas Kenya’s framework is structured to encourage reinvestment and offset losses. These divergences in tax design substantiate the paper’s central claim that corporate tax regimes in East Africa are not neutral but constitute potential sources of investment diversion ((Erokhin, 2023); (OECD, 2023)).
The IBI Breakdown by Parameter (see Table 1) provides a more aggregated lens, showing how the statutory values translate into overall investment burden. Uganda’s negative IBI score (–2.16, or ~0.99 normalised) is substantially heavier than Kenya’s lighter burden (–0.33, ~0.99). Yet the FDI–IBI comparison table (see Table 3) reveals a paradox: despite heavier tax burdens, Uganda attracted US$ 1,553 million in FDI inflows in 2023, compared to only US$ 461 million for Kenya. This finding suggests that tax-induced diversion cannot be understood in isolation from sectoral dynamics. In Uganda, oil-related investments and regional positioning compensated for statutory disadvantages, whereas Kenya’s lighter regime was not sufficient to attract inflows on the same scale. This aligns with (UNCTAD, 2023) observation that sectoral resource endowments often outweigh fiscal incentives in driving FDI inflows. The second objective of numerically comparing tax regimes is therefore met, but the findings also caution against oversimplifying the relationship between statutory tax burdens and FDI behaviour ((IMF, 2023)).
From a sectoral perspective, the tables provide clear implications aligned with the third objective. In the automobile sector, Uganda’s high excises on petrol and diesel (see Table 2) increase logistics costs, diverting automobile importers and distributors toward Kenya, which offers cheaper transport inputs. For the energy sector, Uganda’s heavier levies are offset by the sheer scale of oil-sector FDI inflows (see Table 3), demonstrating that natural resource endowments may outweigh tax frictions; however, in renewable and clean energy segments, Kenya’s exemptions and incentives make it comparatively more attractive ((World Bank, 2023)). In agriculture and agro-processing, Uganda’s excise-heavy regime increases costs of production, nudging firms to establish processing facilities in Kenya where corporate tax incentives encourage reinvestment. Finally, in fast-moving consumer goods (FMCGs), Uganda’s statutory predictability provides revenue stability, but Kenya’s loss carry-forward provision (see Table 1) enhances competitiveness by allowing multinational firms to reinvest and expand market share without immediate tax penalties ((KPMG, 2025); (PwC, 2025)).
Taken together, the descriptive evidence partially supports the study’s claim of tax-induced investment diversion. Uganda’s higher burden does correlate with sector-specific diversions in manufacturing, logistics, and consumer goods, while Kenya’s lighter tax design strengthens its competitive position in these sectors. However, the case of Uganda’s oil-driven FDI demonstrates that sectoral opportunities can override tax burdens, meaning the diversion effect is mediated by natural endowments and market structures. Thus, the claim is supported but with impetus: taxation matters, yet its effect on investment diversion is contingent upon the sectoral context and the presence of non-tax investment drivers ((UNCTAD, 2023); (IMF, 2023); (OECD, 2023)).
5. Conclusion
In this paper, we tested whether statutory differences in corporate taxation between Kenya and Uganda create investment frictions that may lead to tax-induced diversion of capital. The descriptive and index-based analysis shows clearly that the two jurisdictions adopt different fiscal philosophies. The Investment Burden Index (IBI) constructed from nineteen statutory parameters indicates that Uganda’s statutory framework is, on aggregate, heavier driven principally by higher excises, capital-gains provisions and withholding taxes whereas Kenya gains relative advantage from investor-friendly measures such as an effectively indefinite loss carry-forward and targeted incentives. However, the empirical juxtaposition of IBI scores with UNCTAD FDI flows for 2023 reveals a nuanced outcome: Uganda attracted considerably larger inflows in 2023 despite a heavier statutory burden. This pattern suggests that taxation matters for investment location decisions, but is not the sole determinant; sectoral factors (notably natural-resource projects), market size, and non-tax investment drivers can offset or even overwhelm statutory tax disadvantages. In short, the study’s central claim that tax differences contribute to diversion is supported in principle, but the effect is conditional and mediated by sectoral dynamics.
The implications of these findings are threefold. First, statutory tax design influences comparative advantages and can shift firm decisions across borders, especially in sectors sensitive to variable operating costs such as transport-intensive manufacturing and FMCGs. Second, the case of Uganda’s high FDI inflows despite a heavier IBI underlines the importance of sector-specific project economics: very large, resource-led investments may swamp the signal sent by statutory tax differences. Third, policymakers should recognise the trade-off between near-term revenue mobilisation and long-term competitiveness; incentives and stability interact with statutory rates to shape investor expectations and behaviour. Taken together, the results argue for a common regional policy: harmonisation or at least coordination of key tax levers under the East African Community would reduce distortions, but such efforts must be sector-sensitive and account for country-specific endowments.
6. Limitations
Several important limitations constrain the strength and generalisability of the study’s claims. The first, and most important in terms of inference about diversion, is the nature of the analysis itself: it is primarily descriptive and deductive. The IBI was built from statutory provisions and used to identify plausible pathways for investment diversion. However, it does not provide a quantified, causal estimate of sectoral diversion. In other words, the analysis can plausibly indicate where and how diversion may occur, but it cannot precisely quantify the magnitude of diversion at the sector level. This limitation follows from the data and design: statutory parameters are policy variables, not random samples, and the current two-country case provides limited cross-sectional variation for robust econometric identification.
The study reveals that statutory corporate taxation differs significantly between Kenya and Uganda, which could influence investment decisions. However, the degree to which these differences translate into measured sectoral diversion remains an open empirical question. The study's construction involves methodological choices that affect numerical outcomes, such as converting local monetary thresholds to USD, encoding "indefinite" loss carry-forward as a proxy, and applying min-max normalisation across only two observations. The study relies on statutory rather than effective tax burdens, which are needed to validate whether statutory differences translate into material differences in after-tax returns. The study also highlights the volatility and project-driven nature of FDI data, which limits the ability to generalize from one year's data. Future research should combine the statutory IBI approach with micro- and sectoral data to better estimate the degree of diversion.
Fundings
This research did not receive any specific grant from public, commercial, or not-for-profit funding agencies.
Conflict of Interest
No conflict of Interest to declare that might have influence the outcome of the paper.
Data Availability Statement
The raw data supporting the conclusions of this article will be made available by the authors, without undue reservation, to any qualified researcher.
Acknowledgments
The author would like to thank all the participants who contributed their valuable time and insights to this study.
References
- Desai, M. A., Foley, C. F., & Hines, J. R. (2005). Do Tax Havens Divert Economic Activity? NBER Working Paper No. 11270. http://www.nber.org/papers/w11270
- Zodrow, G. R. (2009). Capital Mobility and Capital Tax Competition. Baker Institute for Public Policy. https://www.bakerinstitute.org/...
- Erokhin, V. (2023). Tax effects on foreign direct investment: Evidence from emerging economies. World Economy, 46(7), 1923–1941. https://doi.org/10.1111/twec.13399
- Organisation for Economic Co-operation and Development (OECD). (2023). Tax challenges arising from digitalisation – Report on base erosion and profit shifting (BEPS). Paris: OECD Publishing. https://doi.org/10.1787/beps-2023
- International Monetary Fund (IMF). (2023). International Corporate Tax Reform. IMF Policy Paper.
- United Nations Conference on Trade and Development (UNCTAD). (2023). World Investment Report 2023: FDI inflows outflows by country. UNCTAD.
- Agodo, O. (1978). The Determinants of U.S. Private Manufacturing Investments in Africa. Journal of International Business Studies, 9(3), 95–107. http://www.jstor.org/stable/154216
- Hartman, D. G. (1982). Tax Policy and Foreign Direct Investment in the United States. NBER Working Paper No. w0967. https://ssrn.com/abstract=302544
- Cleeve, E. (2008). How do tax holidays affect inward FDI? African Economic Research Consortium. ResearchGate
- International Monetary Fund (IMF). (2024). Citizens’ Perception of Tax Authorities and Tax Efficiency in Africa. IMF Working Paper.
- Tanzi, V., & Zee, H. H. (2001). Tax Policy for Developing Countries. IMF Economic Issues, No. 27.
- Tibor Hanappi & Whyman, D. (2025). Tax and Investment by Multinational Enterprises (OECD Taxation Working Papers No. 64). OECD Publishing. https://doi.org/10.1787/e817ce39-
- Tewodros, S. (2025). East Africa Economic Outlook 2025. Deloitte Insights. https://www.deloitte.com/.../africa-economic-outlook.html
- International Trade Administration. (2023a). Kenya Country Commercial Guide: Market Overview. https://www.trade.gov/kenya-market-overview
- International Trade Administration. (2023b). Uganda Country Commercial Guide: Market Overview. https://www.trade.gov/uganda-market-overview
- World Bank. (2023). Doing business indicators and investment trends in Sub-Saharan Africa. Washington, DC: World Bank.
- KPMG. (2025). Finance Act 2025: Kenya analysis. Nairobi: KPMG East Africa.
- PricewaterhouseCoopers (PwC). (2025). Kenya and Uganda corporate tax summaries. PwC Tax Summaries.
- Ferguson, V. D., Krupa, T. J., & Laux, R. C. (2025). Tax Administration Quality and Foreign Investment in Developing Countries: Evidence from Participation in Tax Inspectors Without Borders. Journal of Accounting and Economics, 101832. https://doi.org/10.1016/j.jacceco.2025.101832